

Sheffield United 25/26: a season review in stats
When is "bang average" not "bang average"? Sam Parry searches for answers in the data.
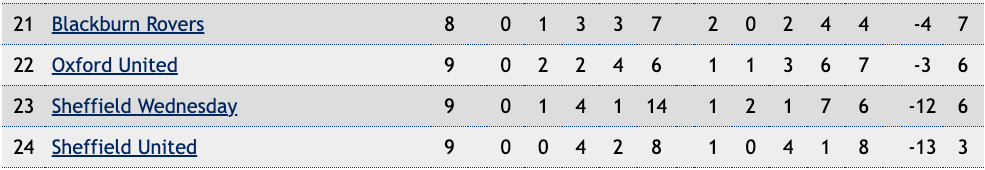
Fans expecting a bang-average finish in mid-October were the eccentrics when Sheffield United were second-bottom, having lost 8 of 9 games. For the first time in ten seasons, mediocrity became aspirational.
This will have been a new feeling for the 14-year-old who took up their first season ticket in 2016/17, only now glimpsing the utter redundancy of a wasted campaign. Some might argue that two hopeless Premier League relegations were more disappointing. Some might pick me up on the fact that in 2017/18 we finished tenth and a good way off the play-offs, but even then, with four games to go, we were three points off fifth. The difference this season is not the annual frustration of being a fan; it’s the downgrading of expectation by off-pitch decisions and on-field meh-ness.
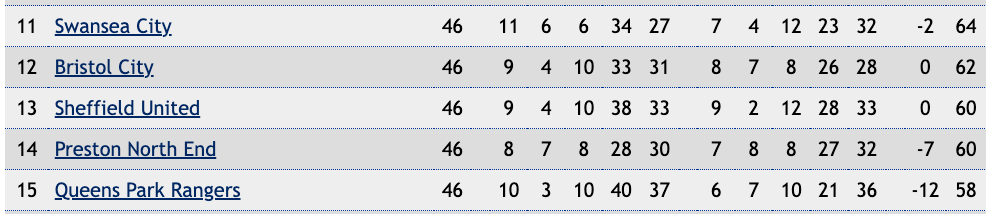
In the static years leading up to our promotion under Neil Warnock, or during our League One wilderness, performances and results were broadly stable, at least relative to themselves. You could tell whether we were in the fight or not by mid-October. This season, by contrast, was defined by volatility rather than sustained mediocrity. You have to look beyond the league table to see it, though, because our 66 goals for and 66 against expose little more than a middling campaign.
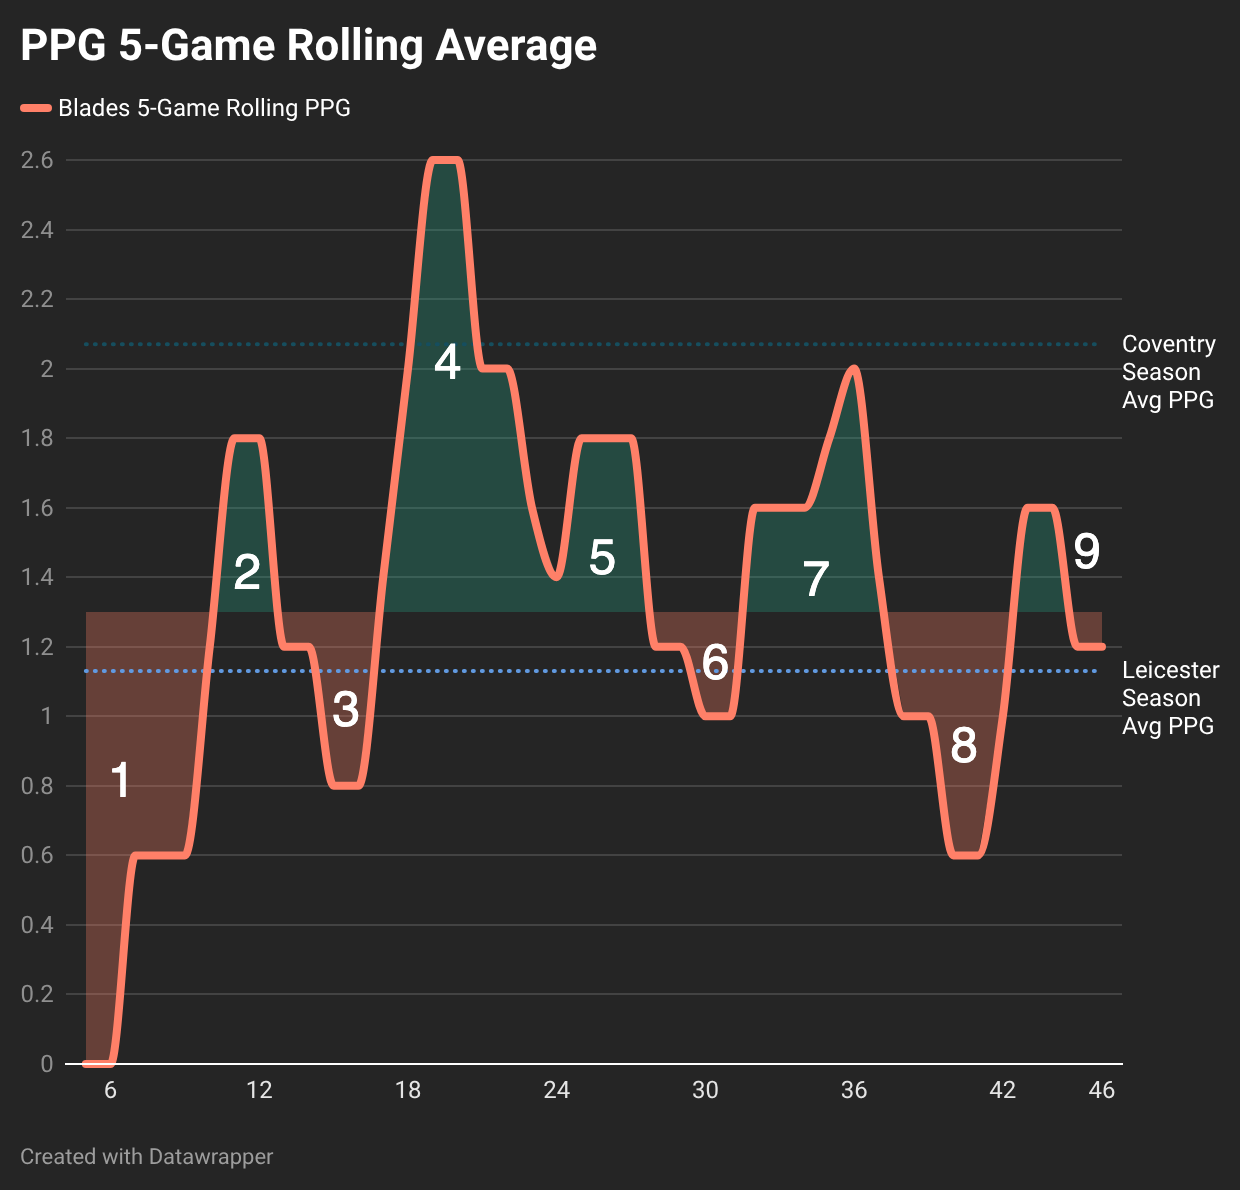
Yes, we were thirteenth when the music stopped. But the way it played out was more like utter volatility in nine stages: (1) Sheffield Wednesday form, (2) play-off form, (3) relegation form, (4) top-2 form, (5) play-off form, (6) mid-table form, (7) play-off form, (8) relegation form, (9) mid-table form.
What on earth happened?
Now that’s a question. And there’s a simple managerial answer that I won’t concern myself with. Neither will this review amount to a play-by-play of matches. Instead, I simply want to try to understand the season a little better using a lot of data underpinned by a fair amount of context. I want to avoid, as much as possible, using stats without that situational evidence. So here’s a timeline of events:
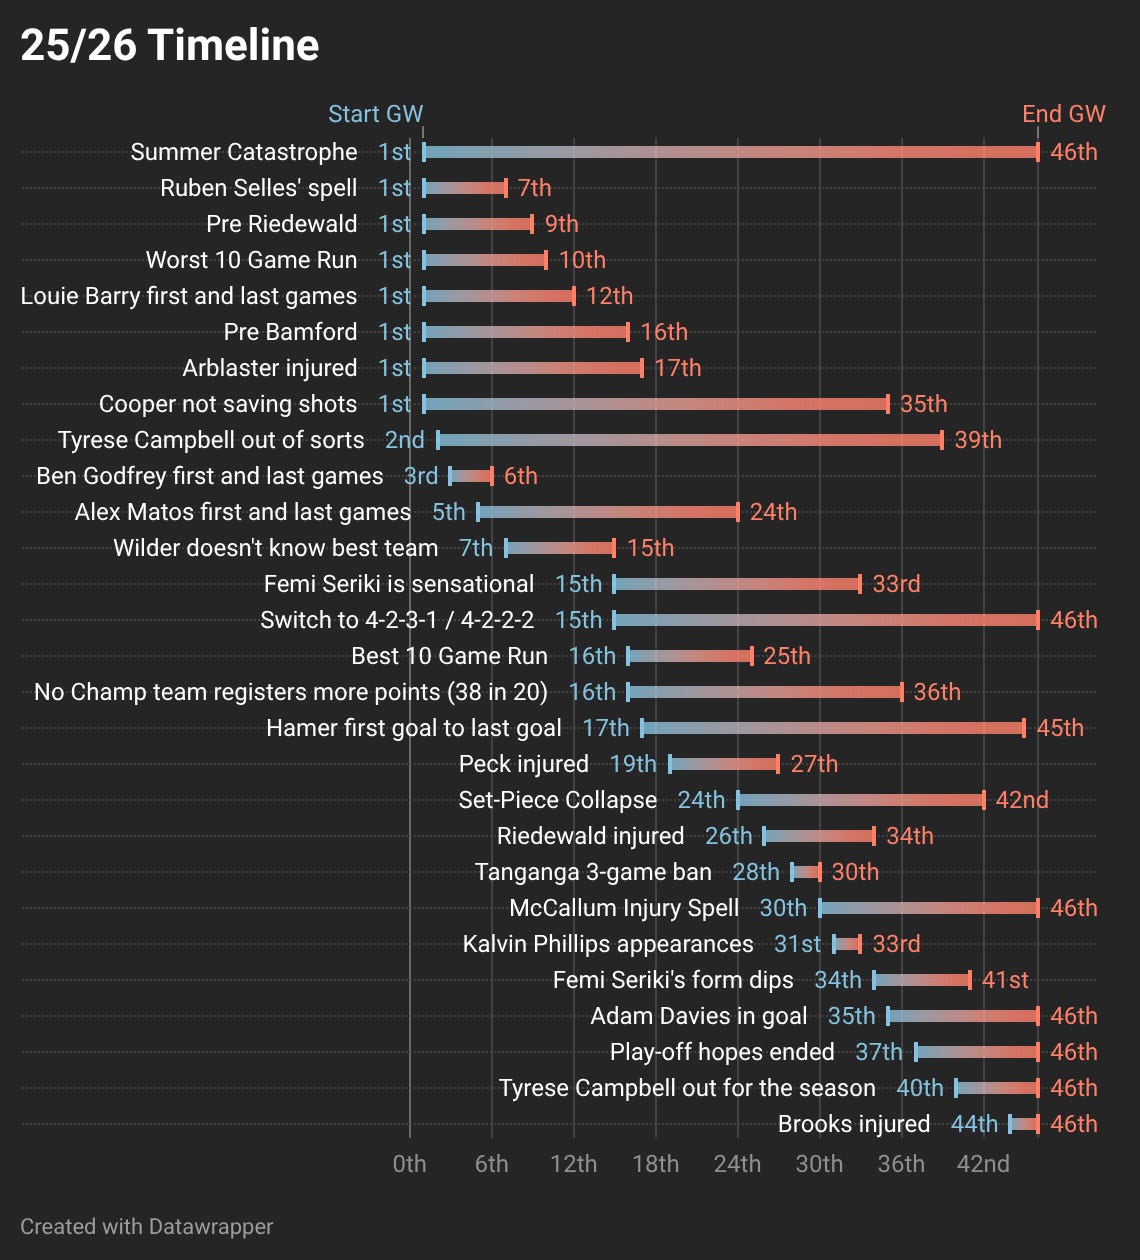
It’s easy to forget about the months missed by Peck and Riedewald. We forget Gus Hamer didn’t score until our 17th game. Most of us have erased from our minds the turgid Sellés-Wilder overlap between the 7th and 15th games of the season. Ultimately, our season is a tale of wasted time, but we shouldn’t let recent events colour our judgement of the whole.
Let’s take things step-by-step…
1. Outcome vs Performance
The currency of football is goals. Scoring them wins games and creating the opportunities to score them, whether you actually turn shots into goals or not, indicates whether the underlying processes are any good. Oh, and turn all that on its head for conceding goals too.
The Blades scored 66 goals (ninth best). By tracking the cumulative average—adding each match’s goal total and dividing it by the number of games played—we can see how the side’s attacking output evolved over time before eventually settling around the 1.4 goals per 90 mark.
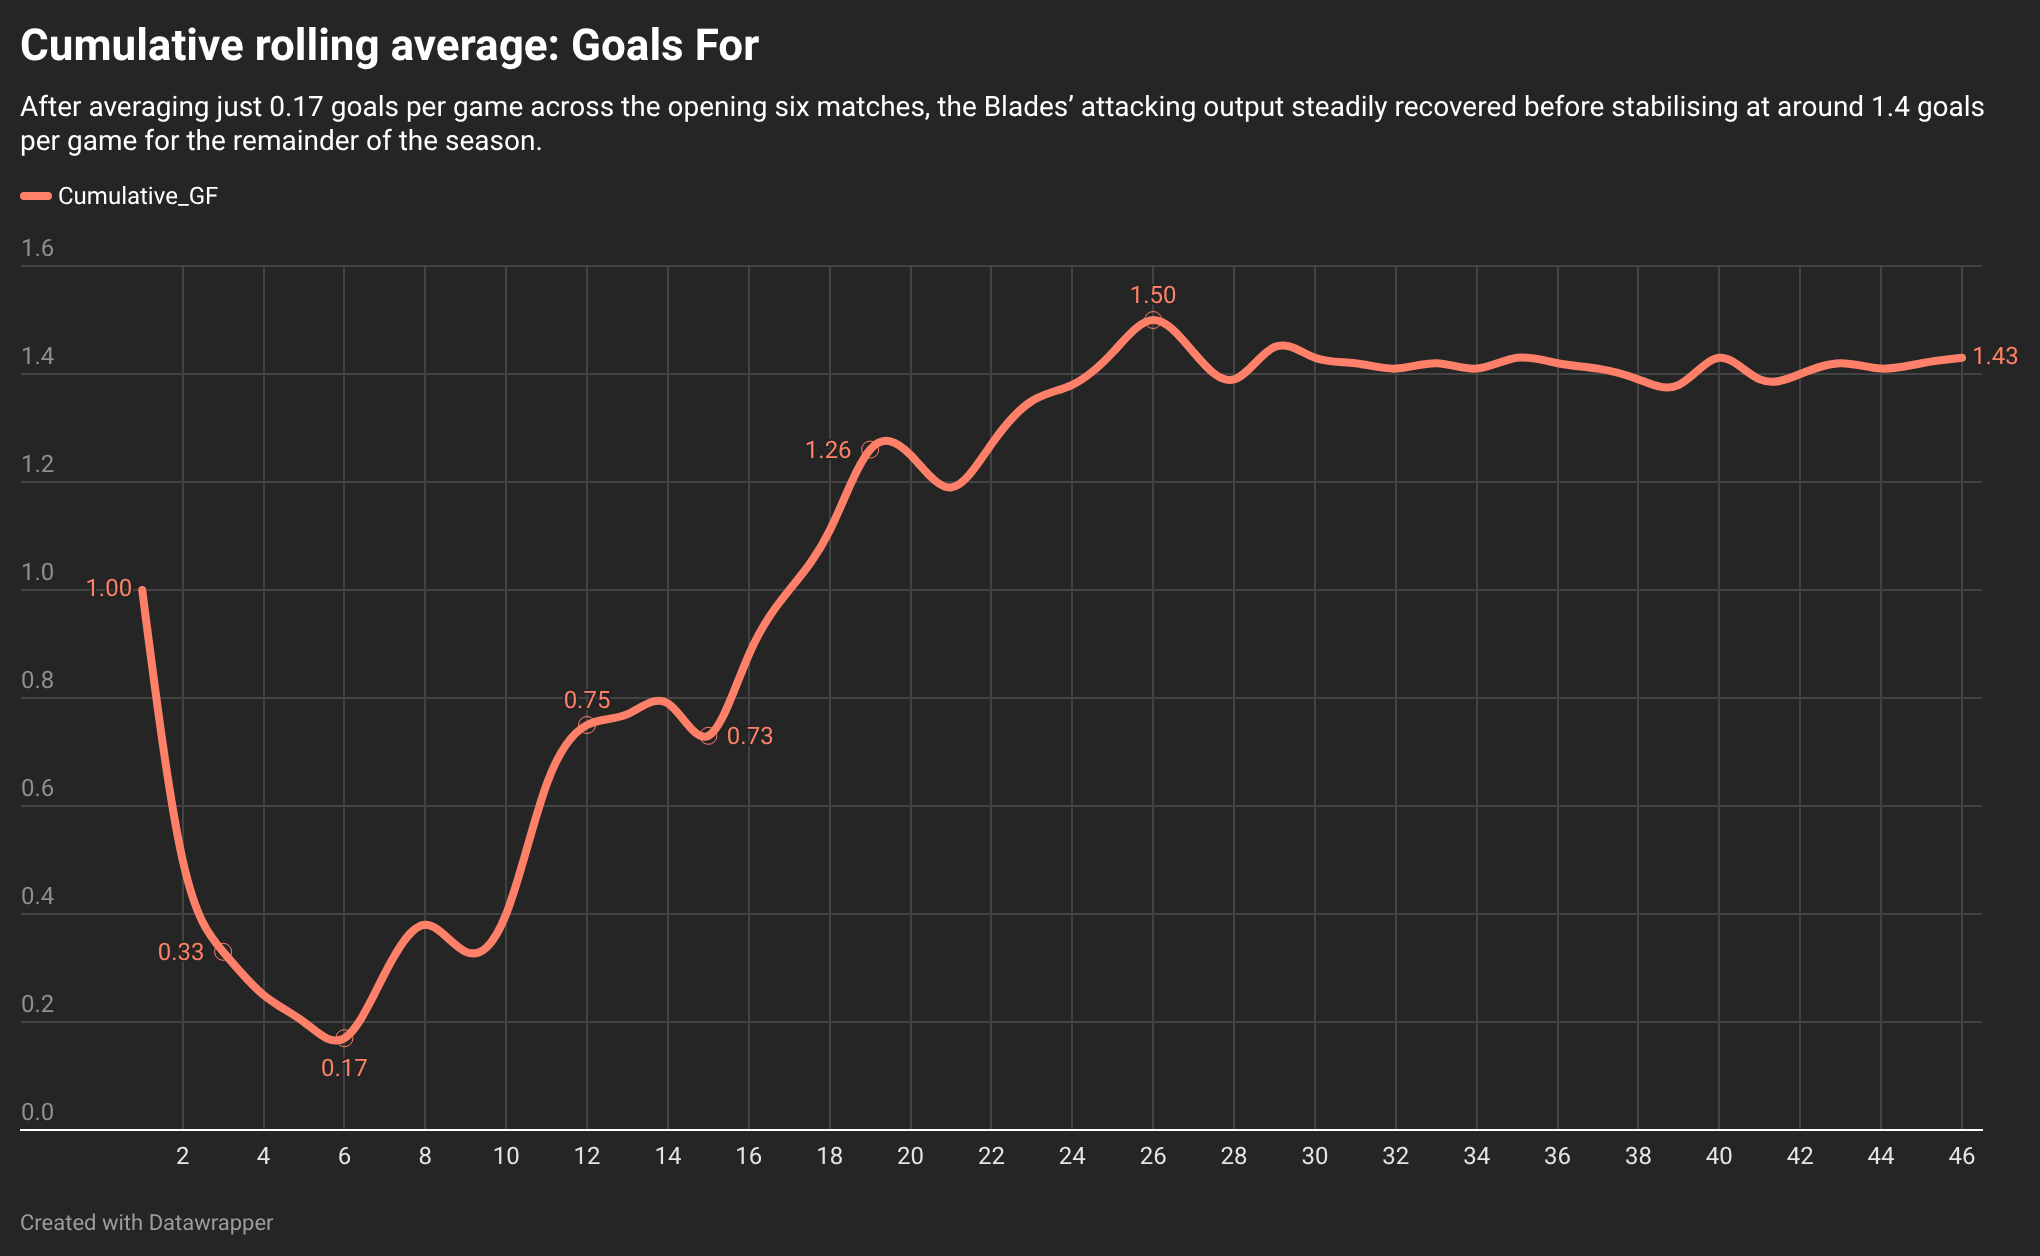
But if we’re going to think of goals as currency, then it pays to consider how we earn our dough: do we work too hard for every goal, do we possess such high-quality finishers that we score from relatively few chances, or are we profligate?
We can get a good idea by comparing the cumulative average of goals scored and comparing them with expected goals: a measure between 0.01 and 0.99 of whether a shot is more or less likely to become a goal based on shot angle, distance, body part and defensive pressure. It’s a measure of chances and their quality.
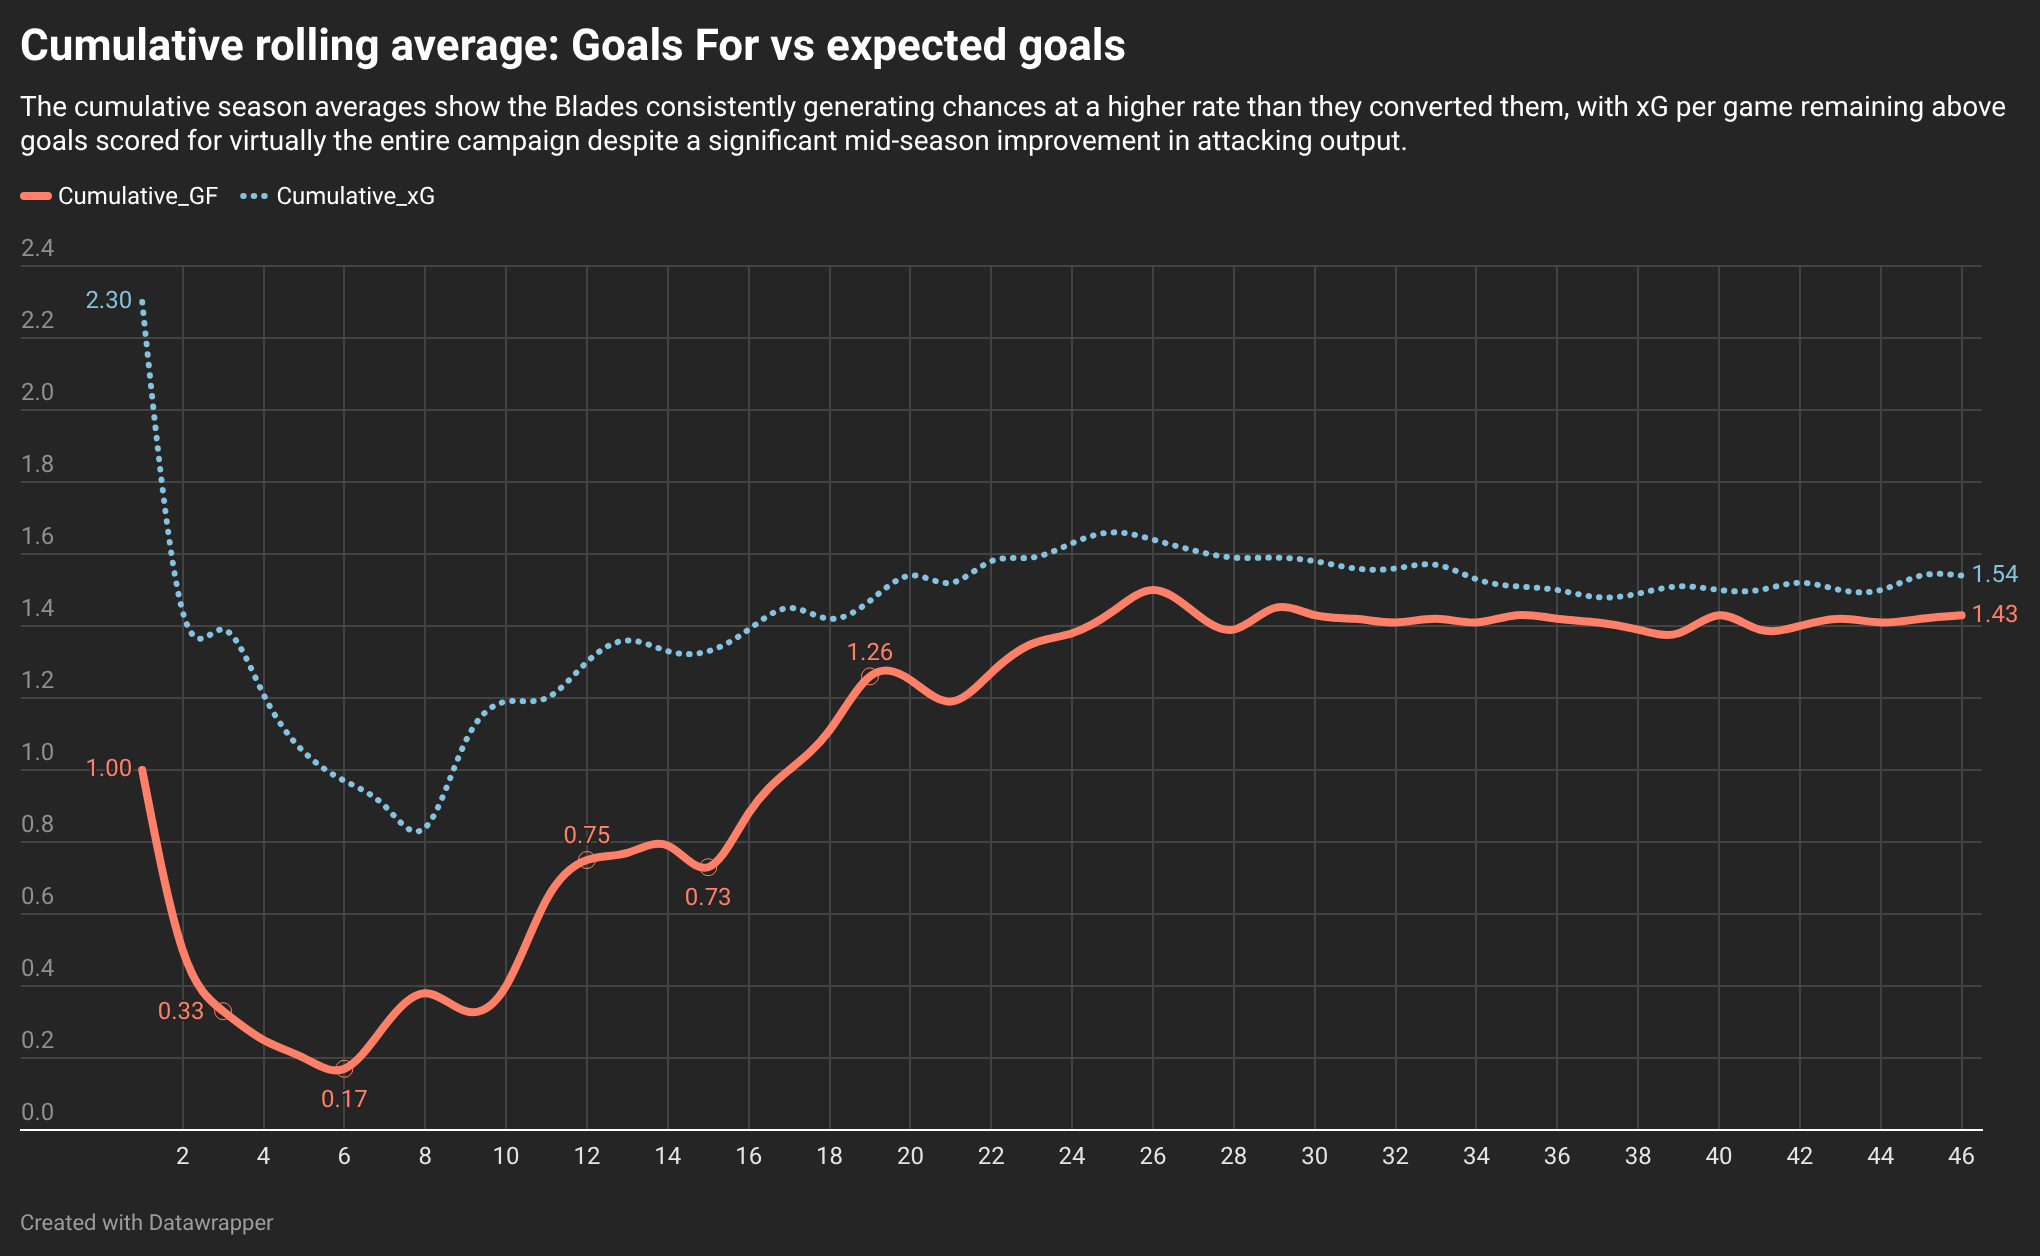
In many examples, underperforming expected goals for an entire season would suggest a lack of quality finishers. I don’t think Sheffield United in 25/26 are representative of that assumption. Our season-long underperformance is utterly inconsistent, formed of missed chances in many games and superlative finishing in others.
Points to consider:
⚫ Tyrese Campbell’s lack of form / presence in the team
⚫ Selling Kieffer Moore
⚫ No Patrick Bamford until the 17th game of the season
A wayward picture, but does it add up to Sheffield United creating more chances than the majority of our opponents?
Sheffield United averaged a 55 per cent share of the expected goals. Over 46 games, this tells us we consistently created more and better chances than our opponents, which, as we know, is not a representative pattern. When we were good, we were very, very good. When we were bad, we were horrid.
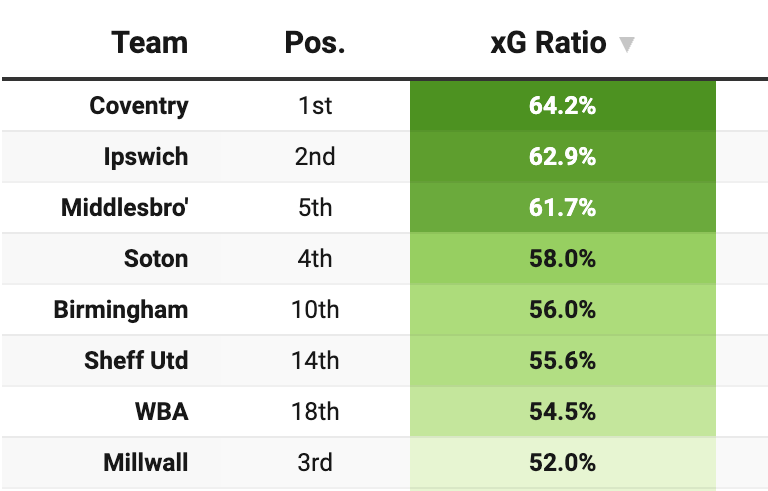
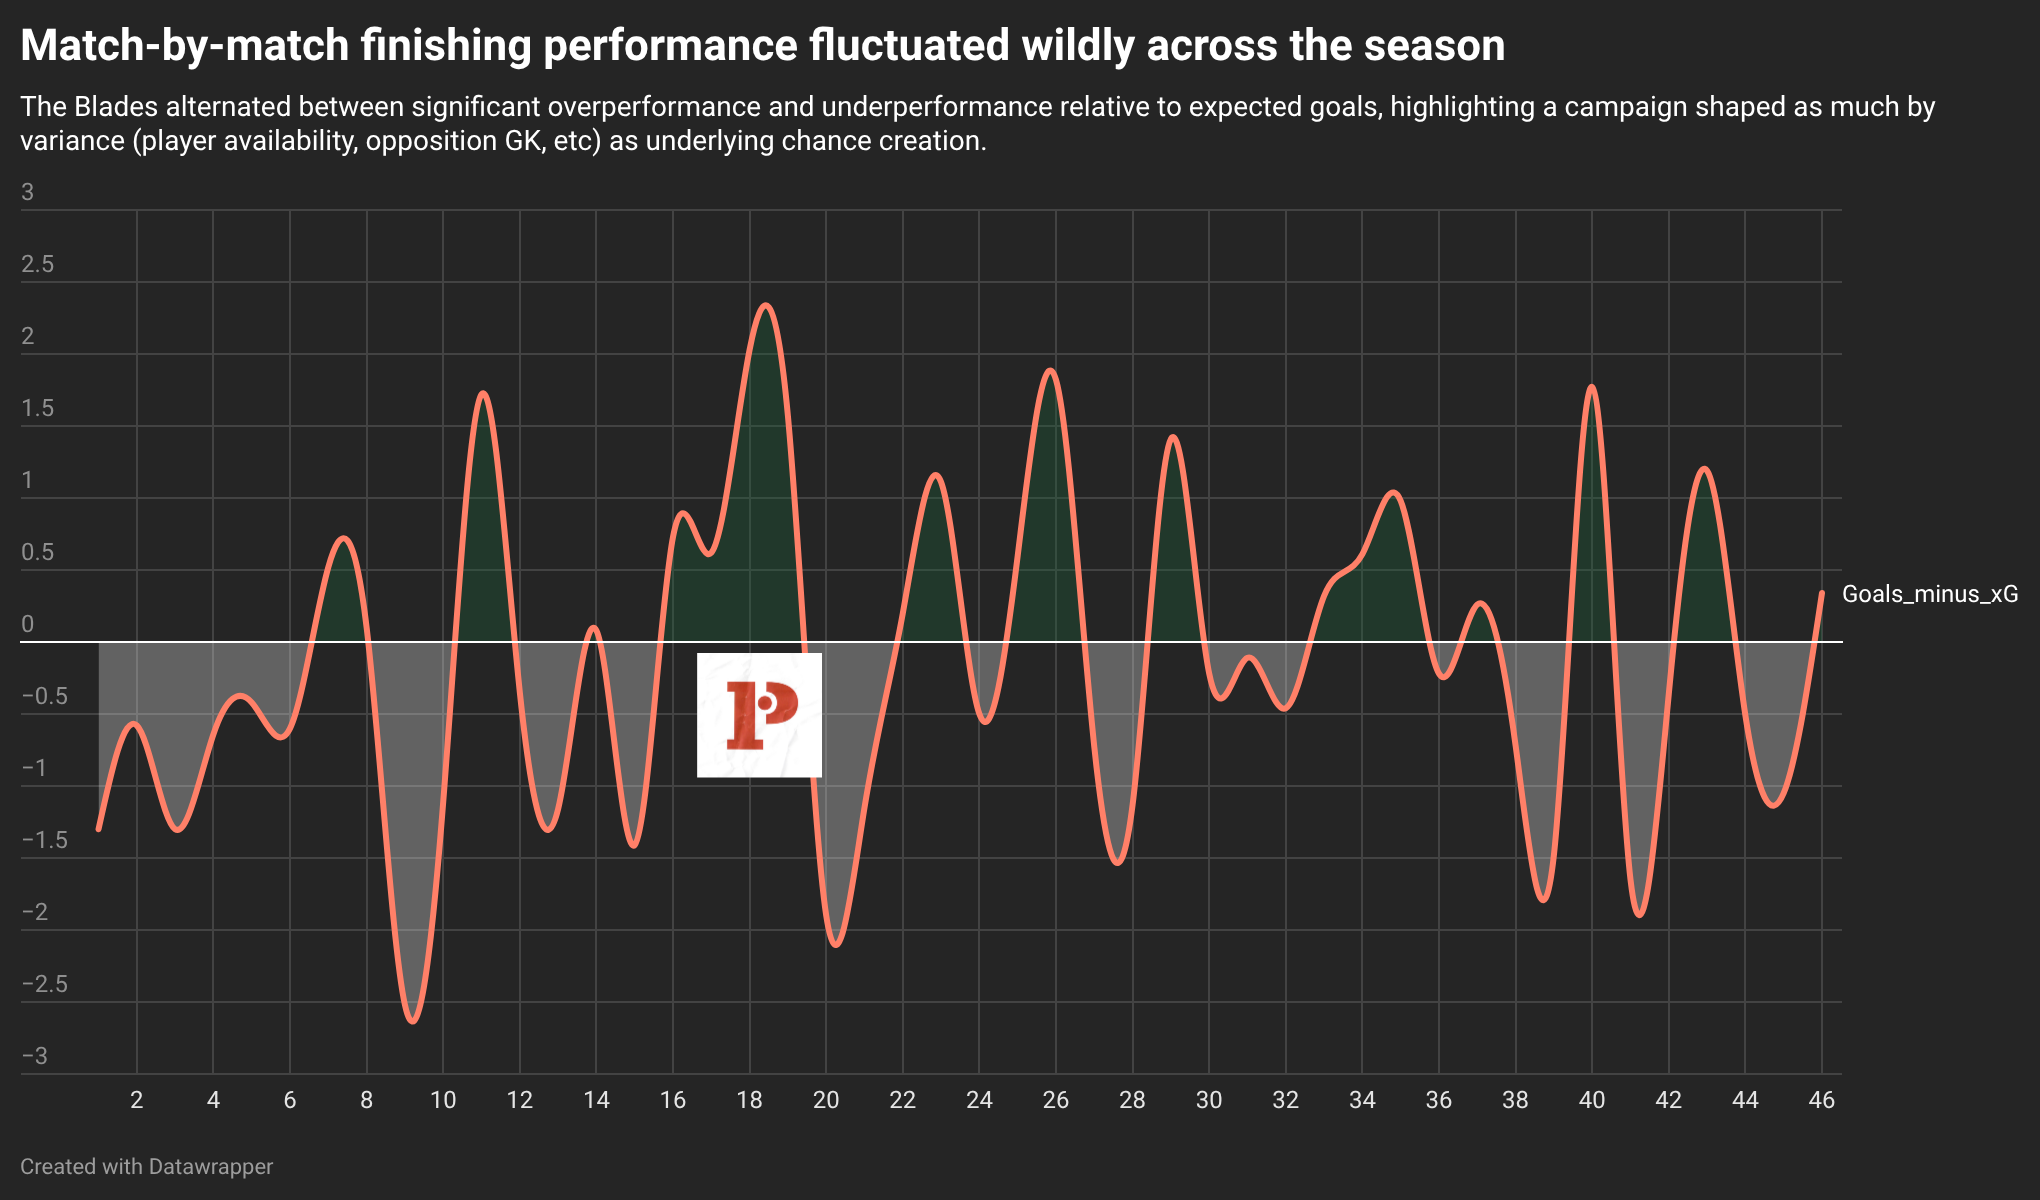
Still, 55 per cent would suggest that, from a total of 132 goals for and against, an expected dispersal, not accounting for variance, would give 72 goals to the Blades and 60 to our opponents. Point of fact: we shared it out equally: 66/66. This was not down to chronic underperformance but chronic instability—it was a season of flux, and we fluctuated wildly, especially at the start and end of the season.
I listed some of the fluctuations in the Timeline (See above), but none are more pointed than Michael Cooper’s drop off. Now there’s the next part of the story. Because if goals are currency, then what kind of value are we getting on the exchange?
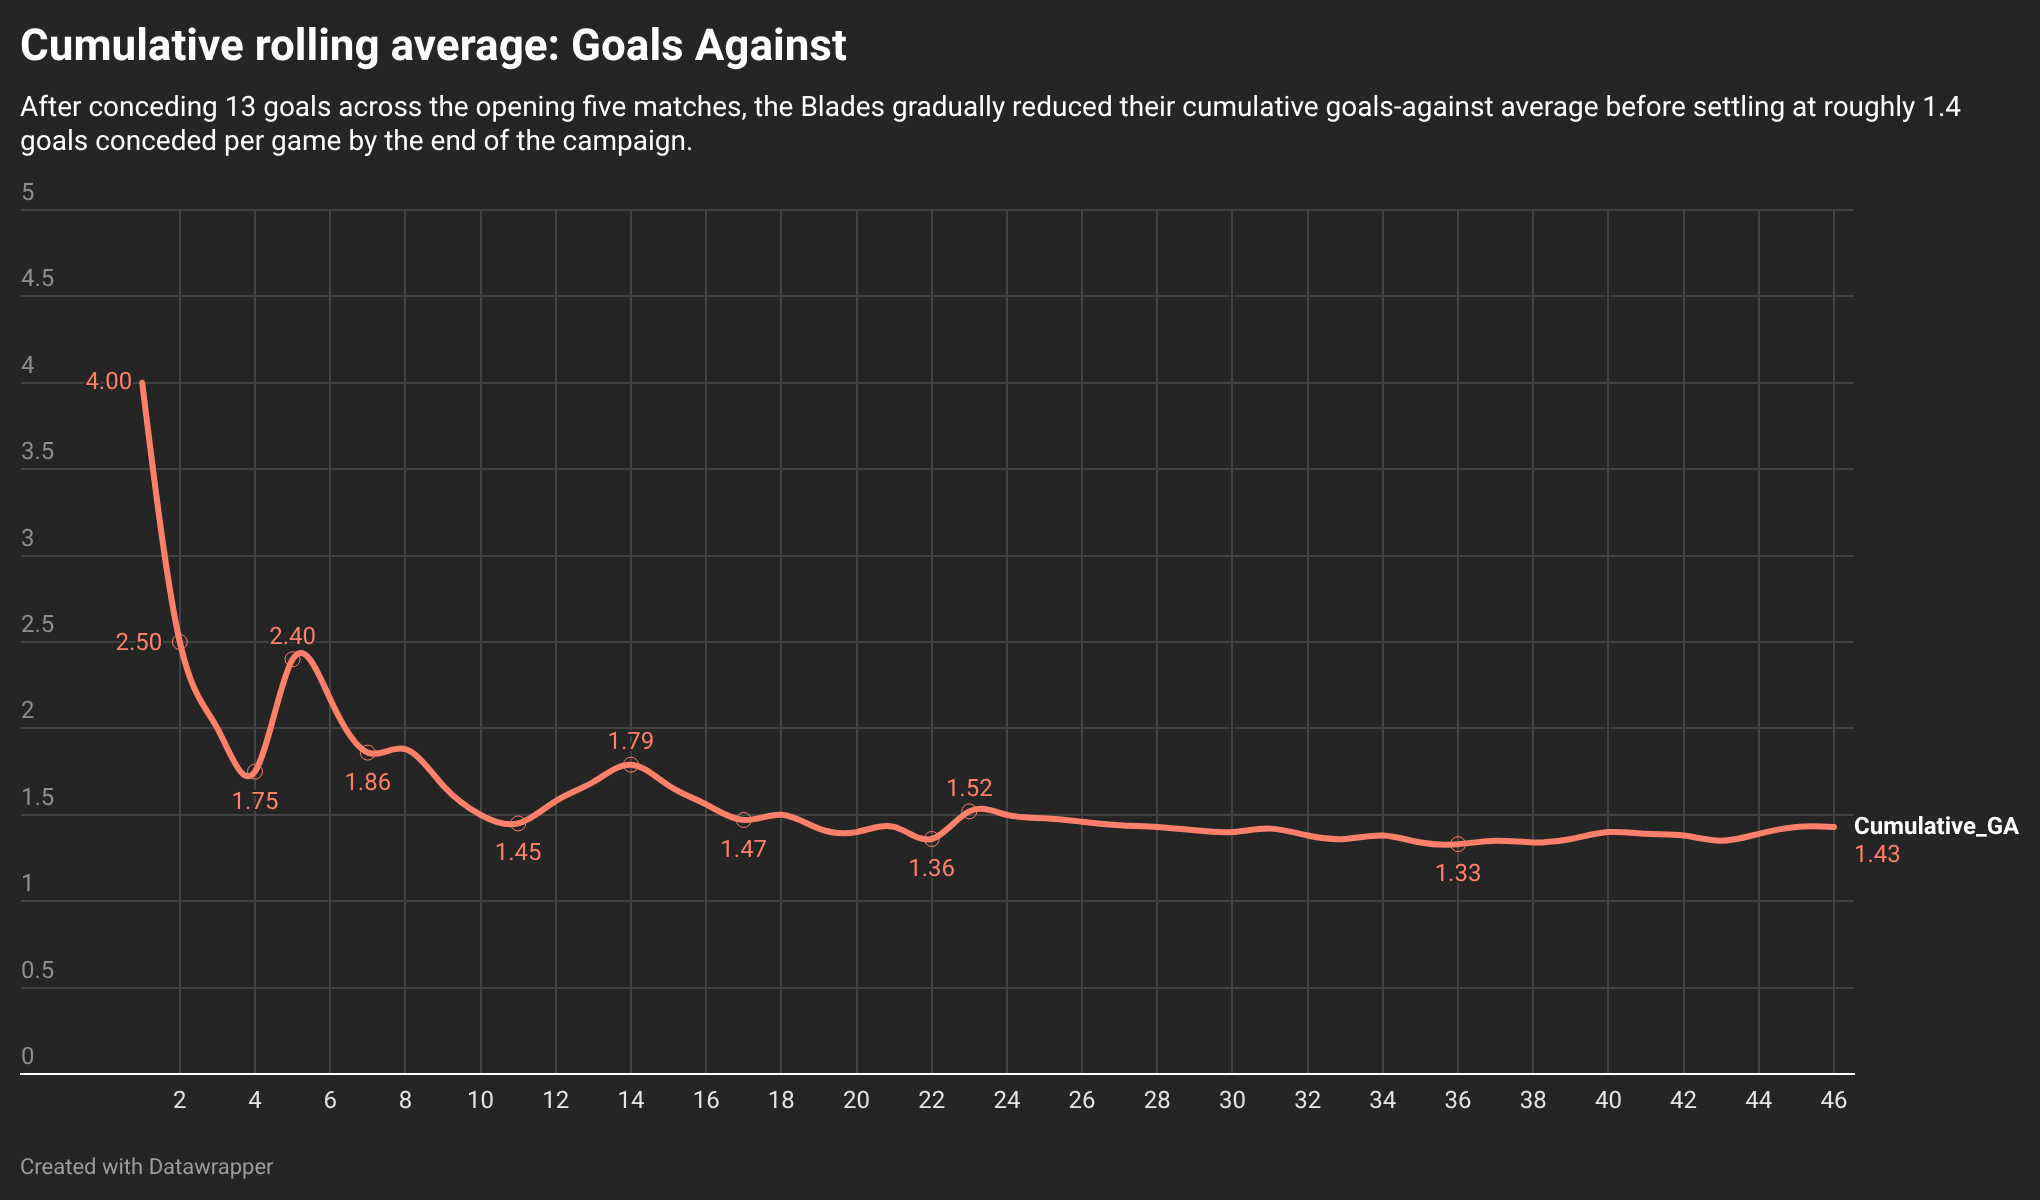
When it comes to goals against, we brought down our average over time, the inverse of our goalscoring over the season. Was this a reasonable return? Should we have conceded more or fewer?
Points to consider:
⚫ Number of different players used in the early part of the season
⚫ Dramatic shift in playing style
⚫ Unsettled defence
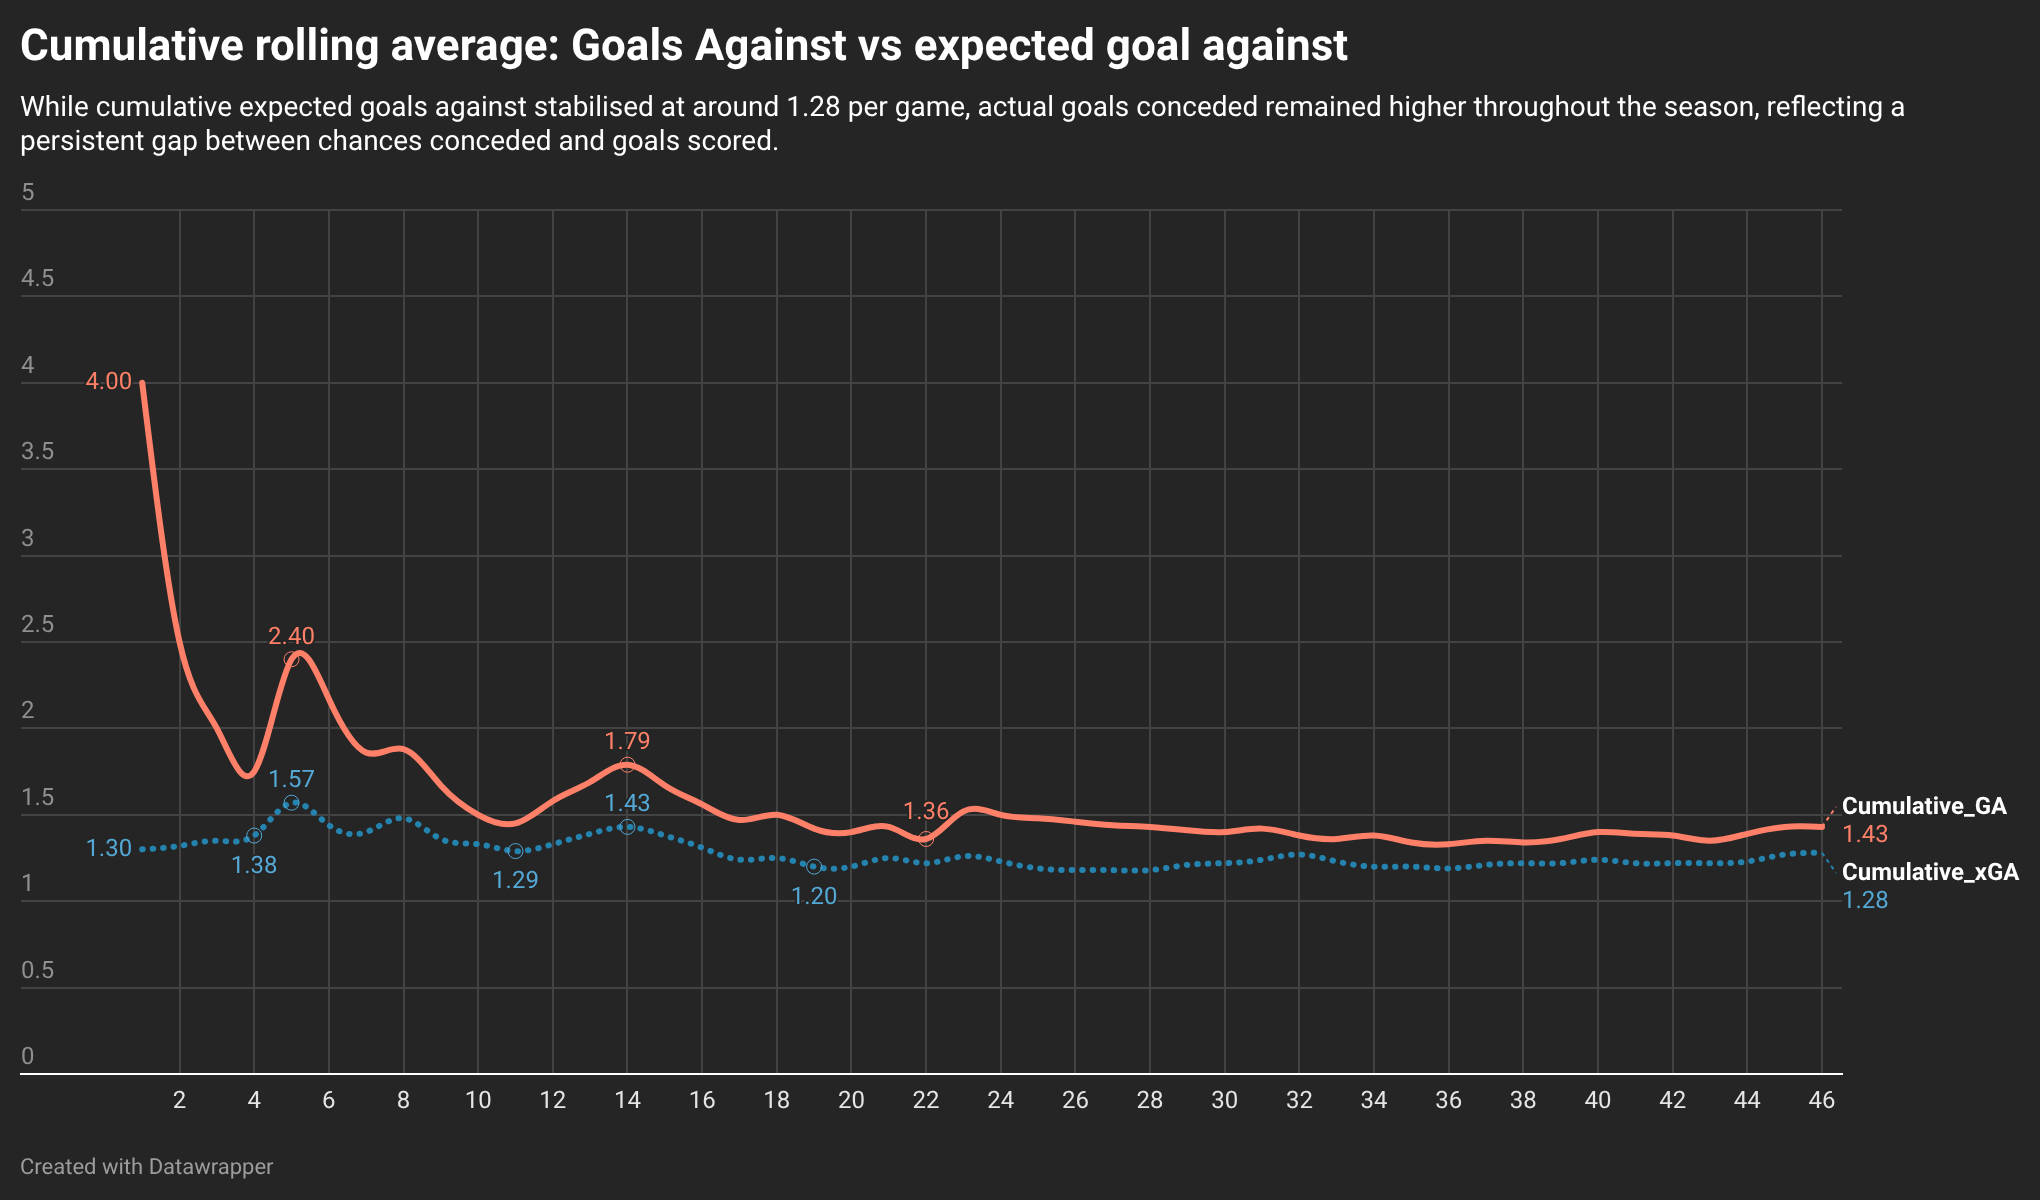
Once again, when comparing GA and xGA over an entire season, there appears to be consistent underperformance at play. And once again, the season average doesn’t tell us about chronic inconsistency. This does 👇
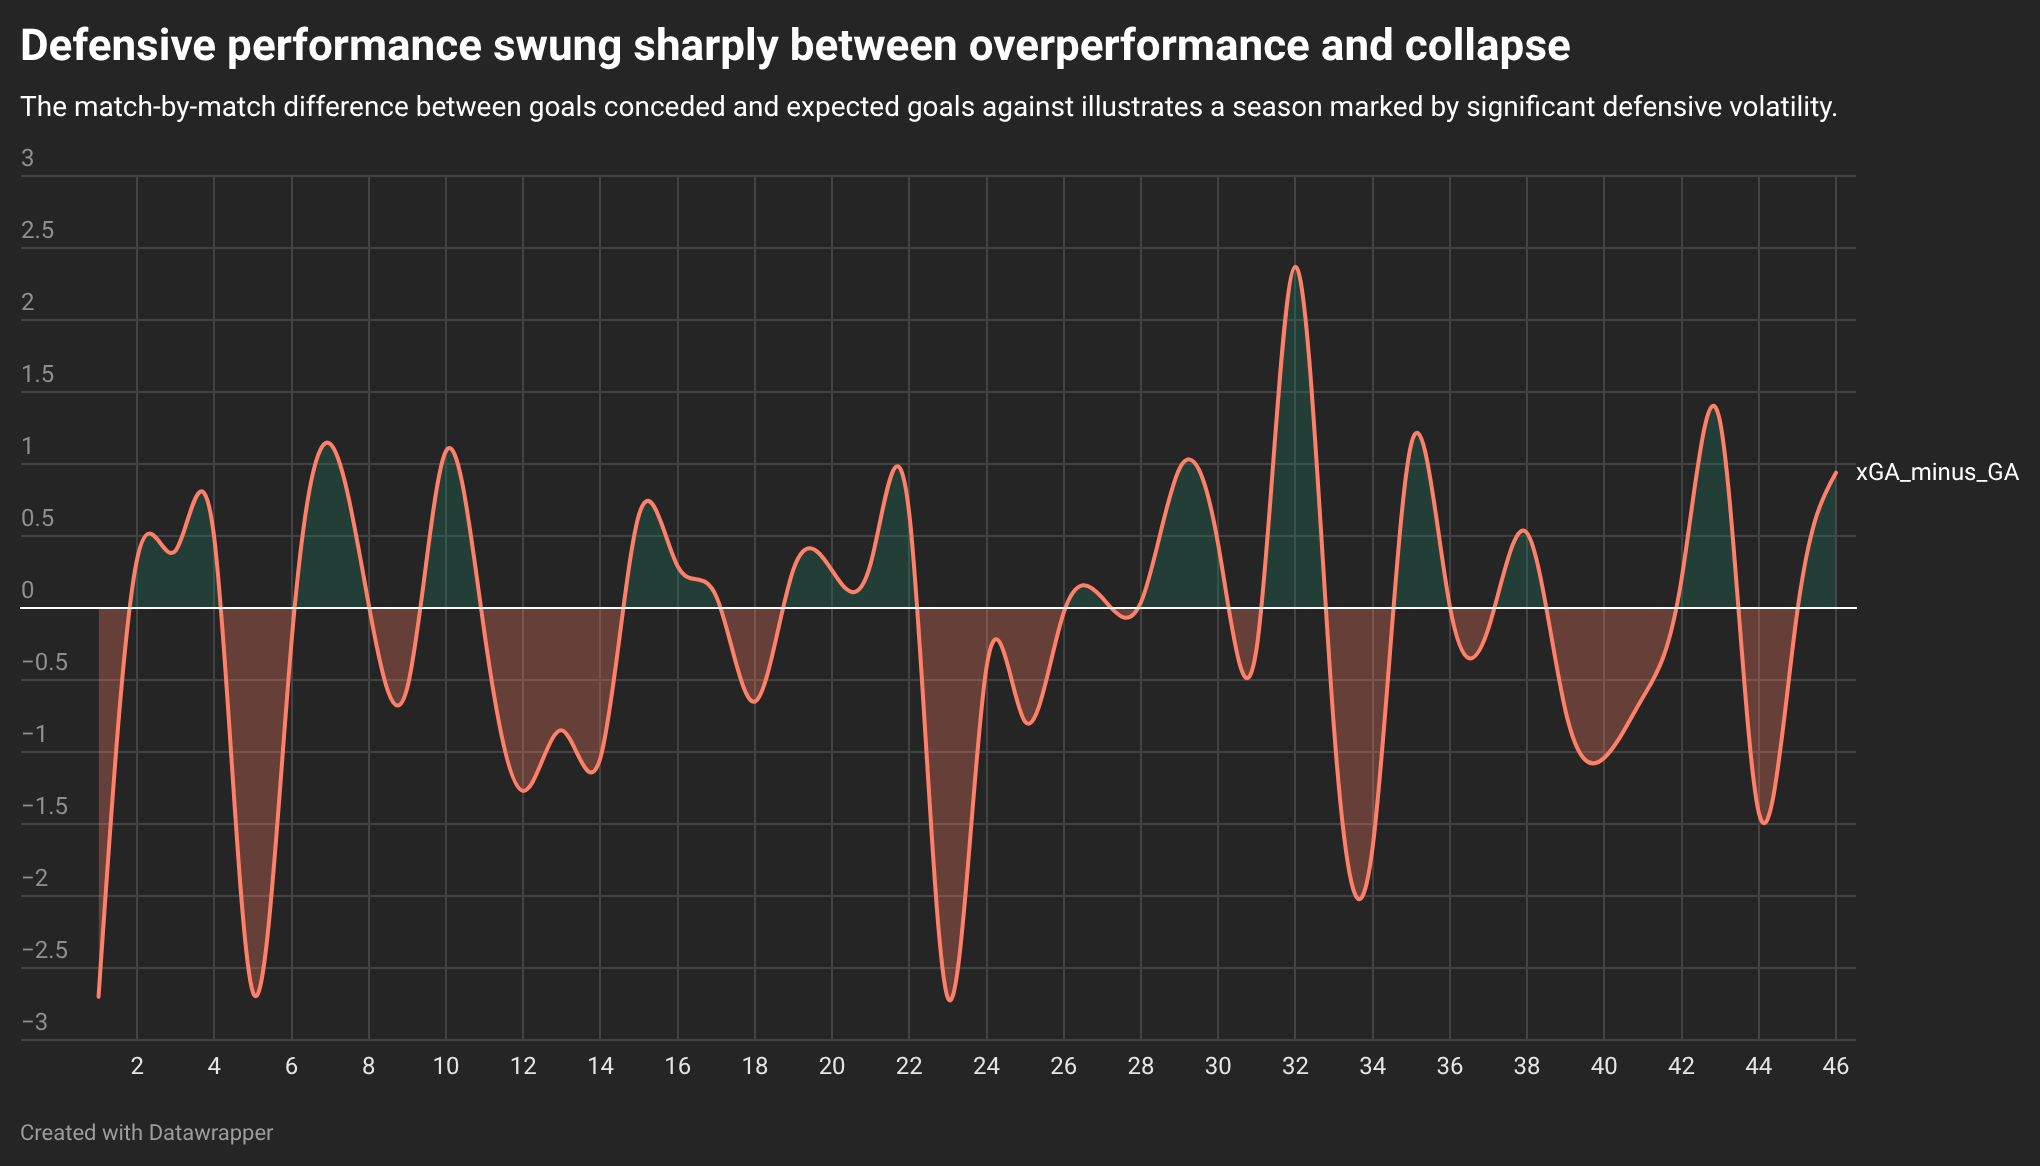
It has been a season of regression and progression. Dips and rises. Ups and downs. However, when we look at our under/over performance on a game-by-game basis, three things strike me as being rather noisy. What would have happened if these three things were not the case?
Michael Cooper’s 12.5 xG swing
24/25 Goals Prevented: +5.7
25/26 Goals Prevented: -6.8
13 different defenders used over the season
8 errors leading to goals/22 leading to shots
Luck… (yes, luck!)
One of the reasons expected goals are maligned is that they do not factor in the context. They are, I would argue, a valuable representation of chances created over time. But on a match-by-match level, other factors influence outcomes, and luck (or variance) is one of those factors.
Have Sheffield United been unlucky?
Luck does not iron itself out over the season. For example, when Sheffield United were at their worst (losing the opening 7 games), only 7 of 23 other teams could have faced us, which means the other 16 clubs had to face us when we were, notionally, better. The inverse is also true.
We played the entire top 6 (Coventry, Ipswich, Millwall, Southampton, Middlesbrough and Hull) before the 8th of November and lost all 6. Why is the 8th of November significant? Because that’s when Femi Seriki was brought back into the side, and we began playing a more balanced 4-2-3-1/4-2-2-2, racking up points, goals and xG along the way.
Suppose we had played the top 6 when we were better? We can’t have done worse than 6 losses. And then again, we also had to face Norwich twice under Philipe Clement, not when they were awful under Liam Manning. We faced Bristol City twice in the first games for two new managers, avoiding their poor runs of form. We didn’t get to face West Brom under Eric Ramsay. We didn’t play Cov in their dip nor Preston in theirs. Fixture-wise, I think we’ve caught the bad end of variance.
But such is life, and it cannot be helped. What can be helped, and what is worth deeper investigation, is how we created and gave away chances.
2. Creating Chances:
Simple question. Where did our goals 66 come from?
⚽ Open Play: 38 goals (58%)
🎯 Set Pieces: 16 goals (24%)
⚡ Counter Attacks: 6 goals (9%)
🥅 Penalties: 4 goals (6%)
🔄 Own Goals: 2 goals (3%)
None of these percentages is out of the ordinary. Especially not for a side that, despite a dreadful season, posted some of the best attacking numbers in the league - we were able to score from open play and did not over-rely on set-pieces. What is surprising, really, is that we didn’t score more considering the positions we got into.
One of the defining features of this campaign, and 24/25 too, was our relative dominance when it comes to the number of touches in the box we record versus our opponents.
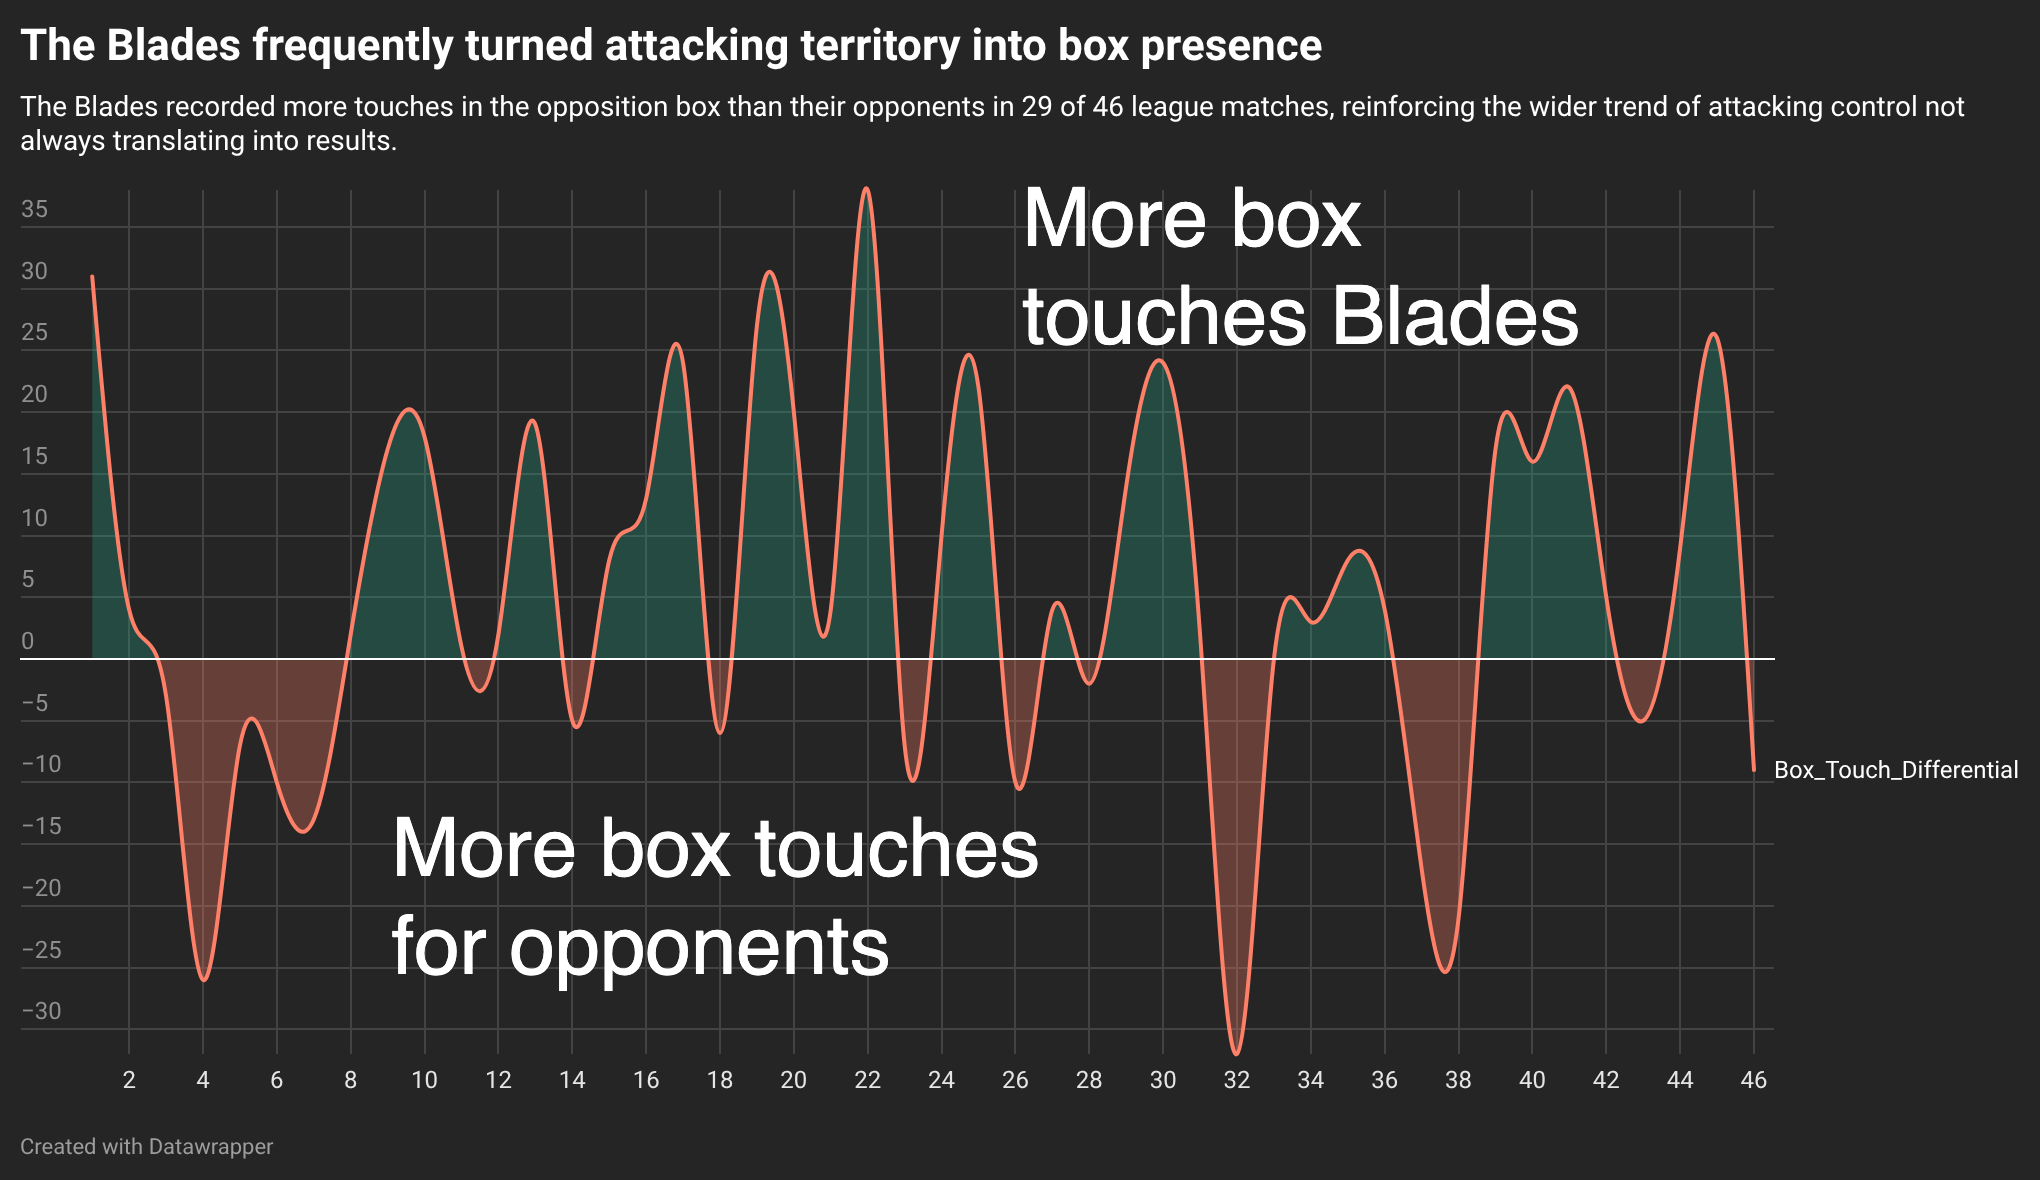
For a side who registered the third-highest touches in the box (behind Boro and Coventry), it’s notable that we returned relatively few goals (compared to those teams’ 72, and especially Cov’s 90).
Part of the problem, as I see it, is that we too often attacked a well-set defence. Meaning we allowed our opponents a greater opportunity to make blocks. That would tally. Of our total shots (600), 30 per cent were blocked.
Still, when a team consistently has more touches in the box than their opponent, and consistently out-shoots them too, then any right-minded person would expect them to finish higher in the table, not lower.
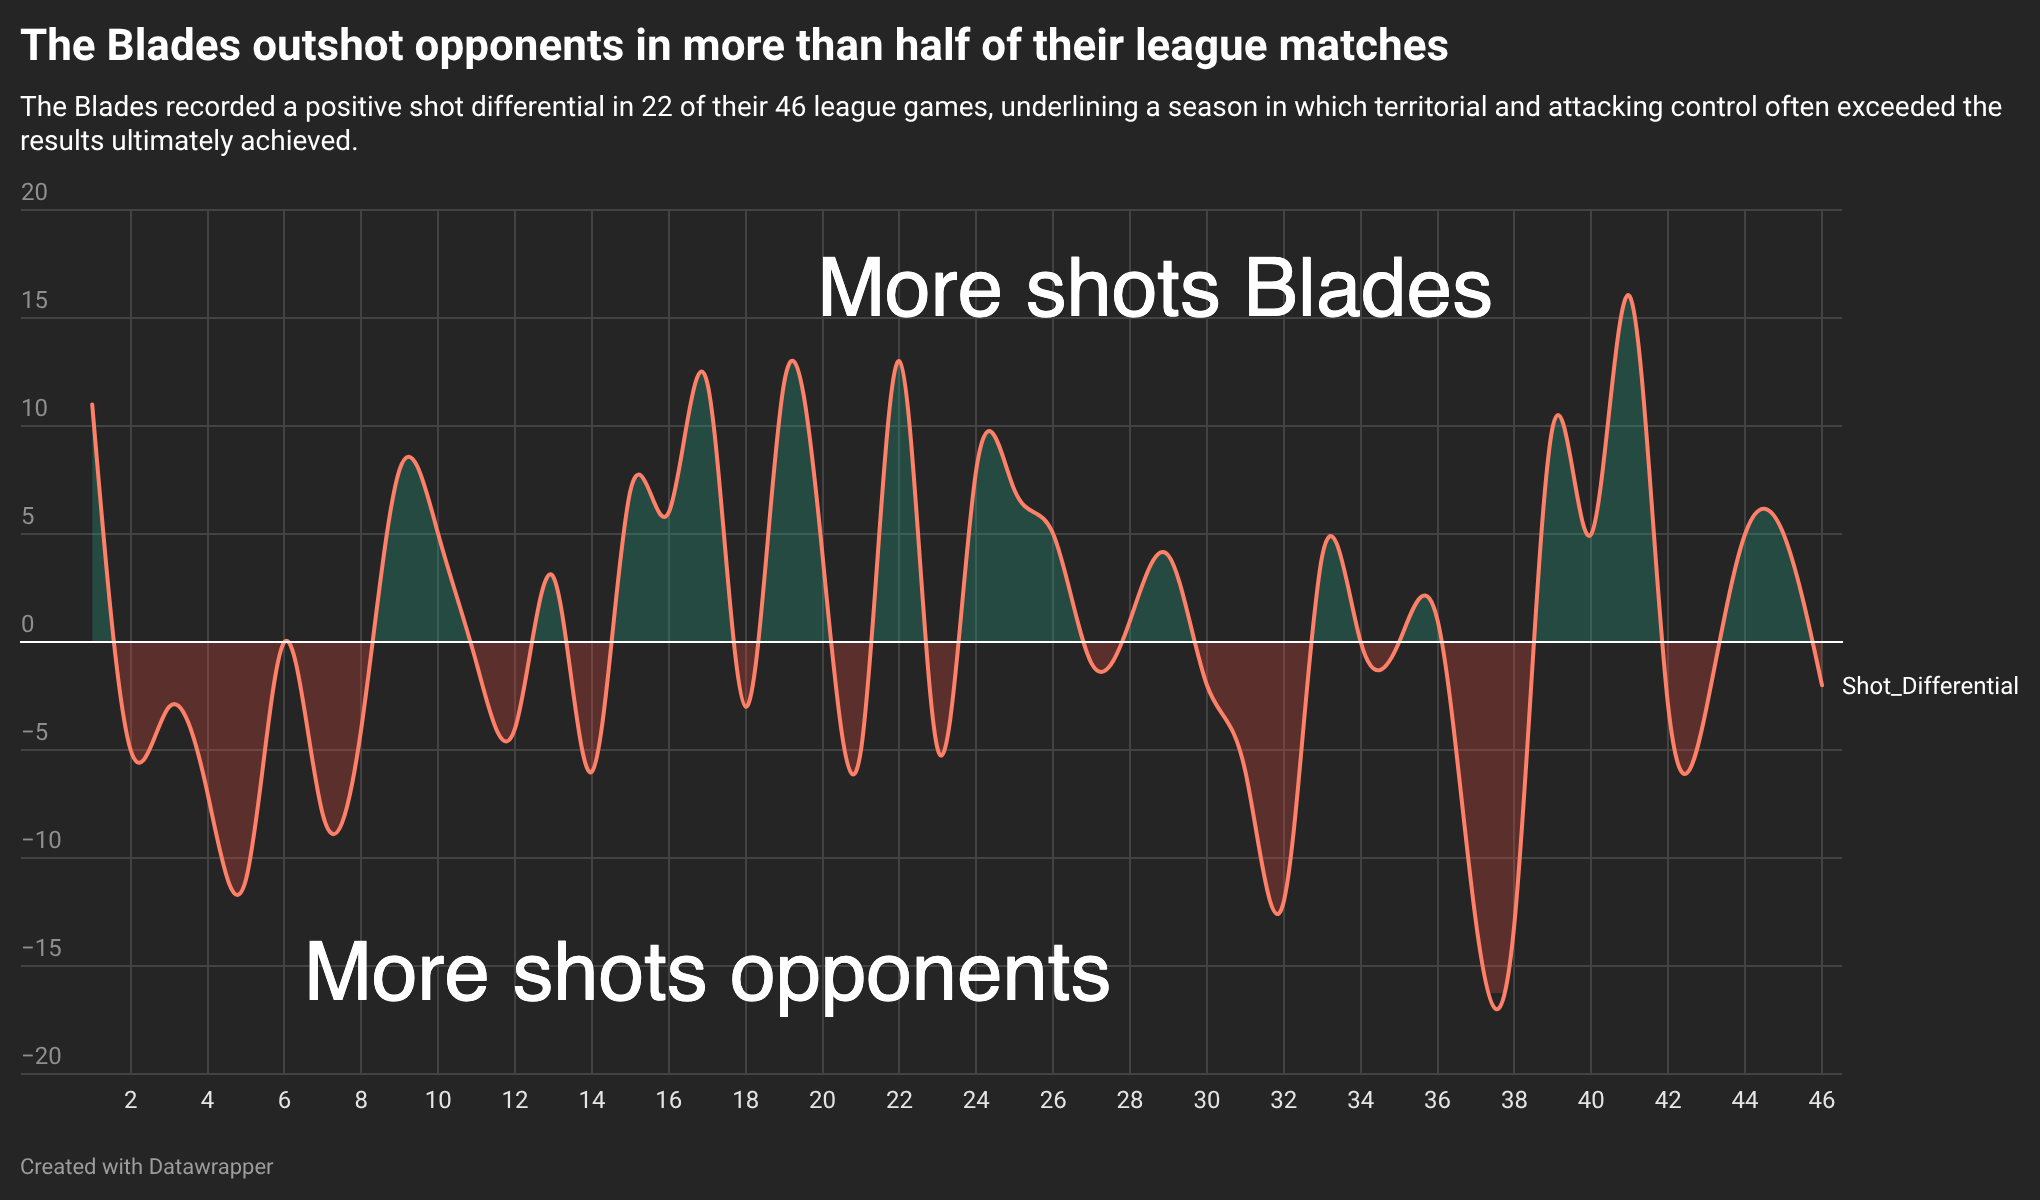
It surprised me just how often we outshot opponents. I thought, therefore, there would be some wrinkle in our shot distances. Maybe we shoot from range more than other teams. But no, our shooting positions are more closely aligned with, say, the best team in the league, Coventry (1st), than the worst (competent) team, Leicester City (23rd).
🎯 Shot Positions:
🥅 6-Yard Box: ⚔️ Blades 10% | 🔵 Cov 10% | 🦊 Leicester 7%
📦 18-Yard Box: ⚔️ Blades 57% | 🔵Cov 60% | 🦊 Leicester 52%
🚀 Outside the Box: ⚔️ Blades 32% | 🔵 Cov 30% | 🦊 Leicester 41%
With the 7th-most shots on target in the league coming from the 4th-best xG, Sheffield United were one of the Championship’s better open-play sides.
What about set pieces?
Aha! The glaring question of whether our much-talked-about set-piece improvement is actually true. In a word: yes.
24/25: 12 set-piece goals
25/26: 16 set-piece goals
The reality is that Sheffield United’s rolling five-game set-play xG peaked above 0.7 in the autumn before steadily collapsing through the second half of the campaign, bottoming out below 0.2 by spring. We still created chances overall, but one of our most reliable attacking routes quietly reduced in its potency over time.
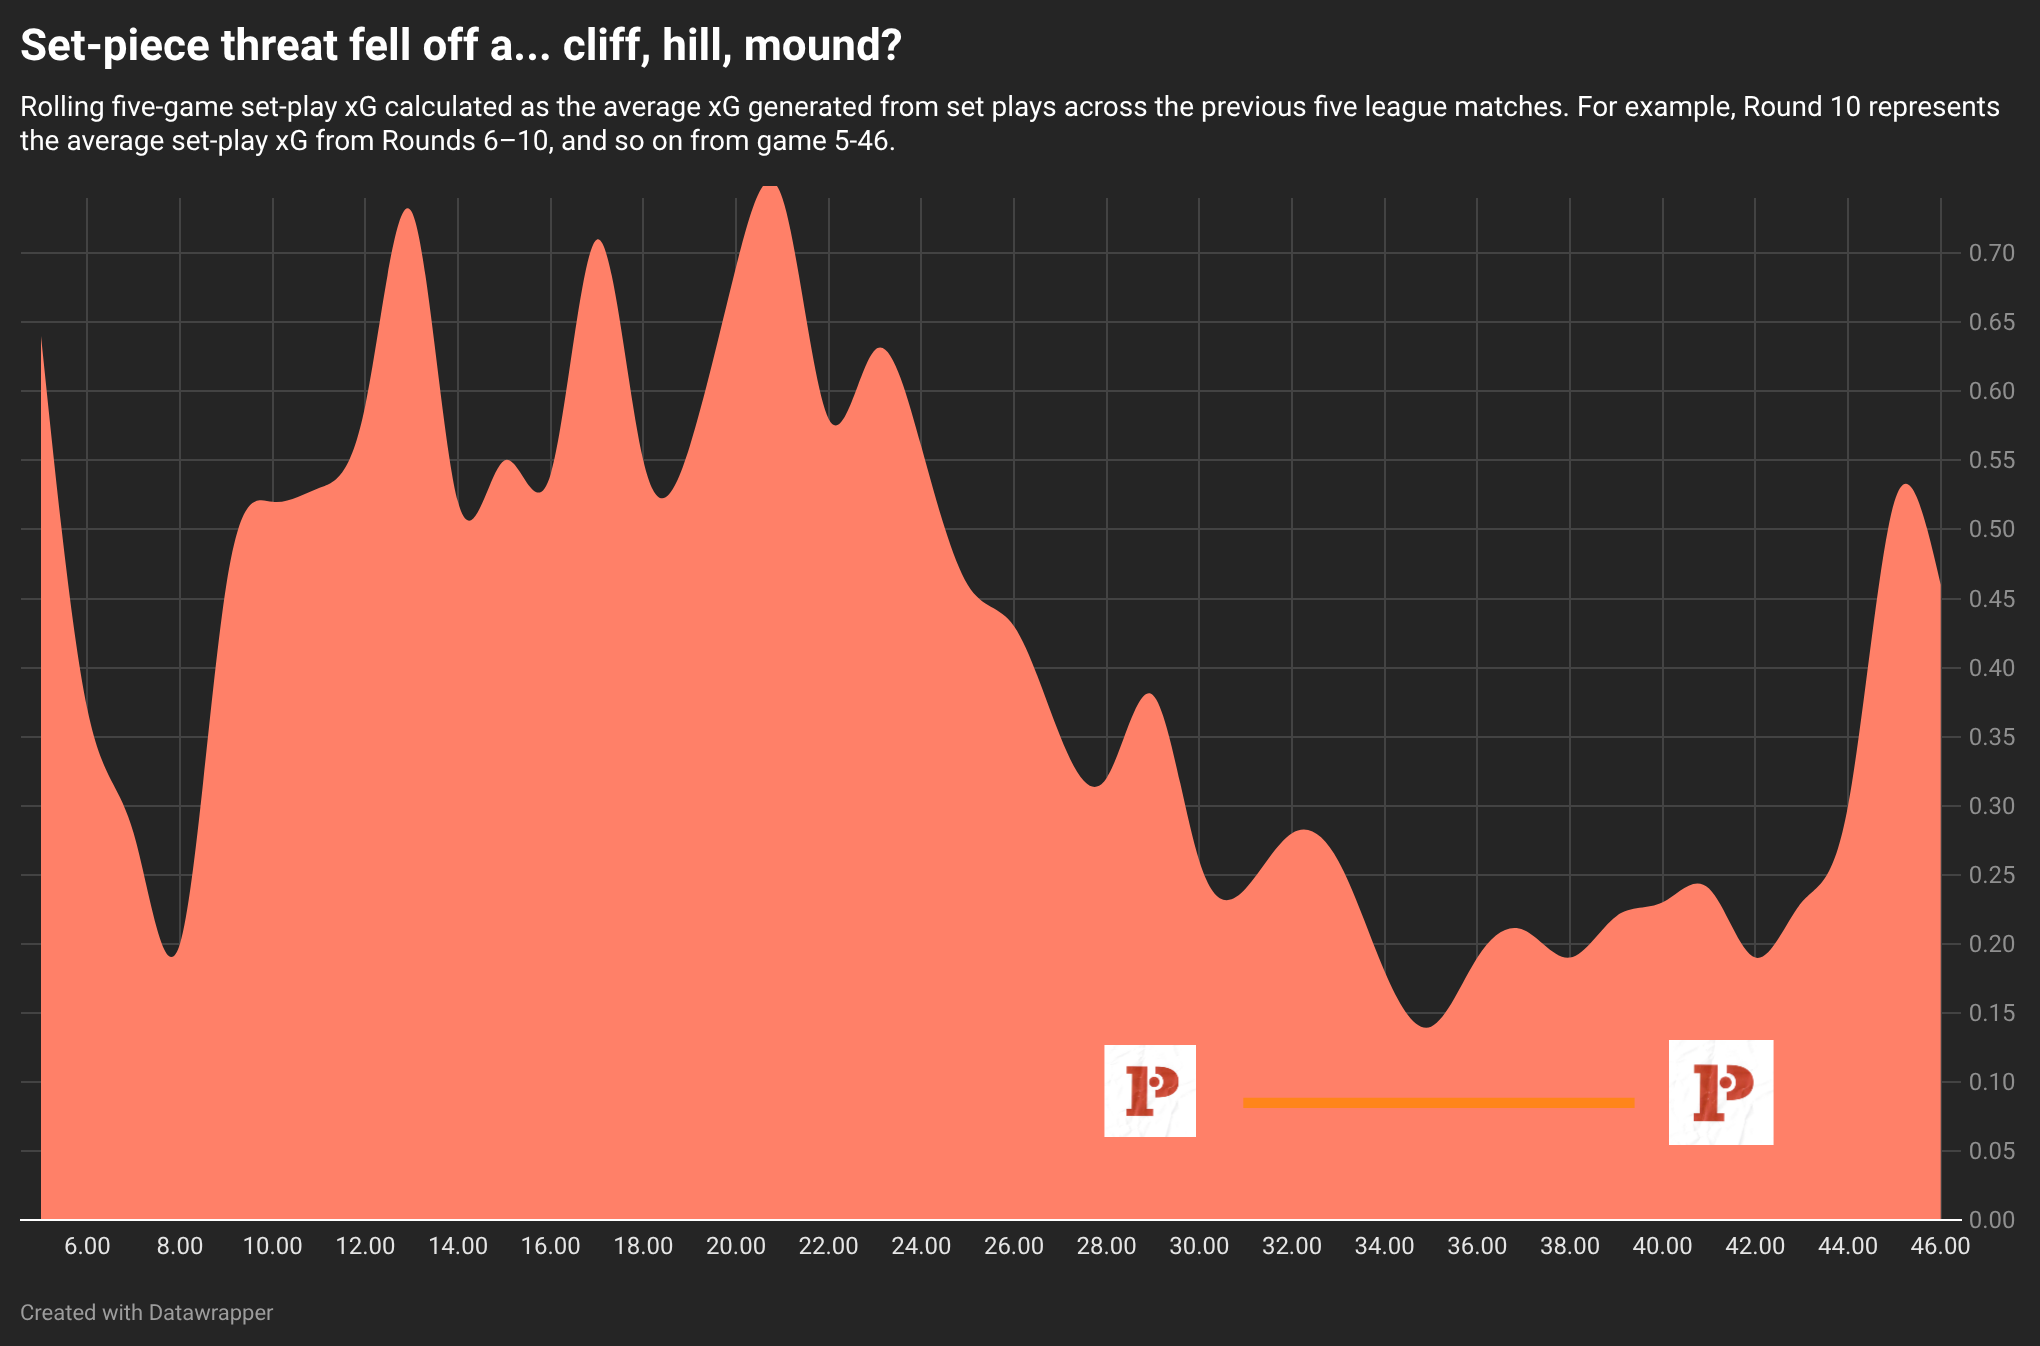
Points to consider:
⚫ Oppositions spotted our approach in the months after Wilder returned
⚫ Loss of Ben Mee/Mark McGuinness (look at the rise with MM at end)
⚫ Loss of Sam McCallum
Yes, set-pieces provided diminishing returns. But it’s important to note that we underperformed our expected tally of 21.44 by almost 7 goals when we had the second-best set-piece xG behind Coventry FGS! Gah.
Small regression = big regression
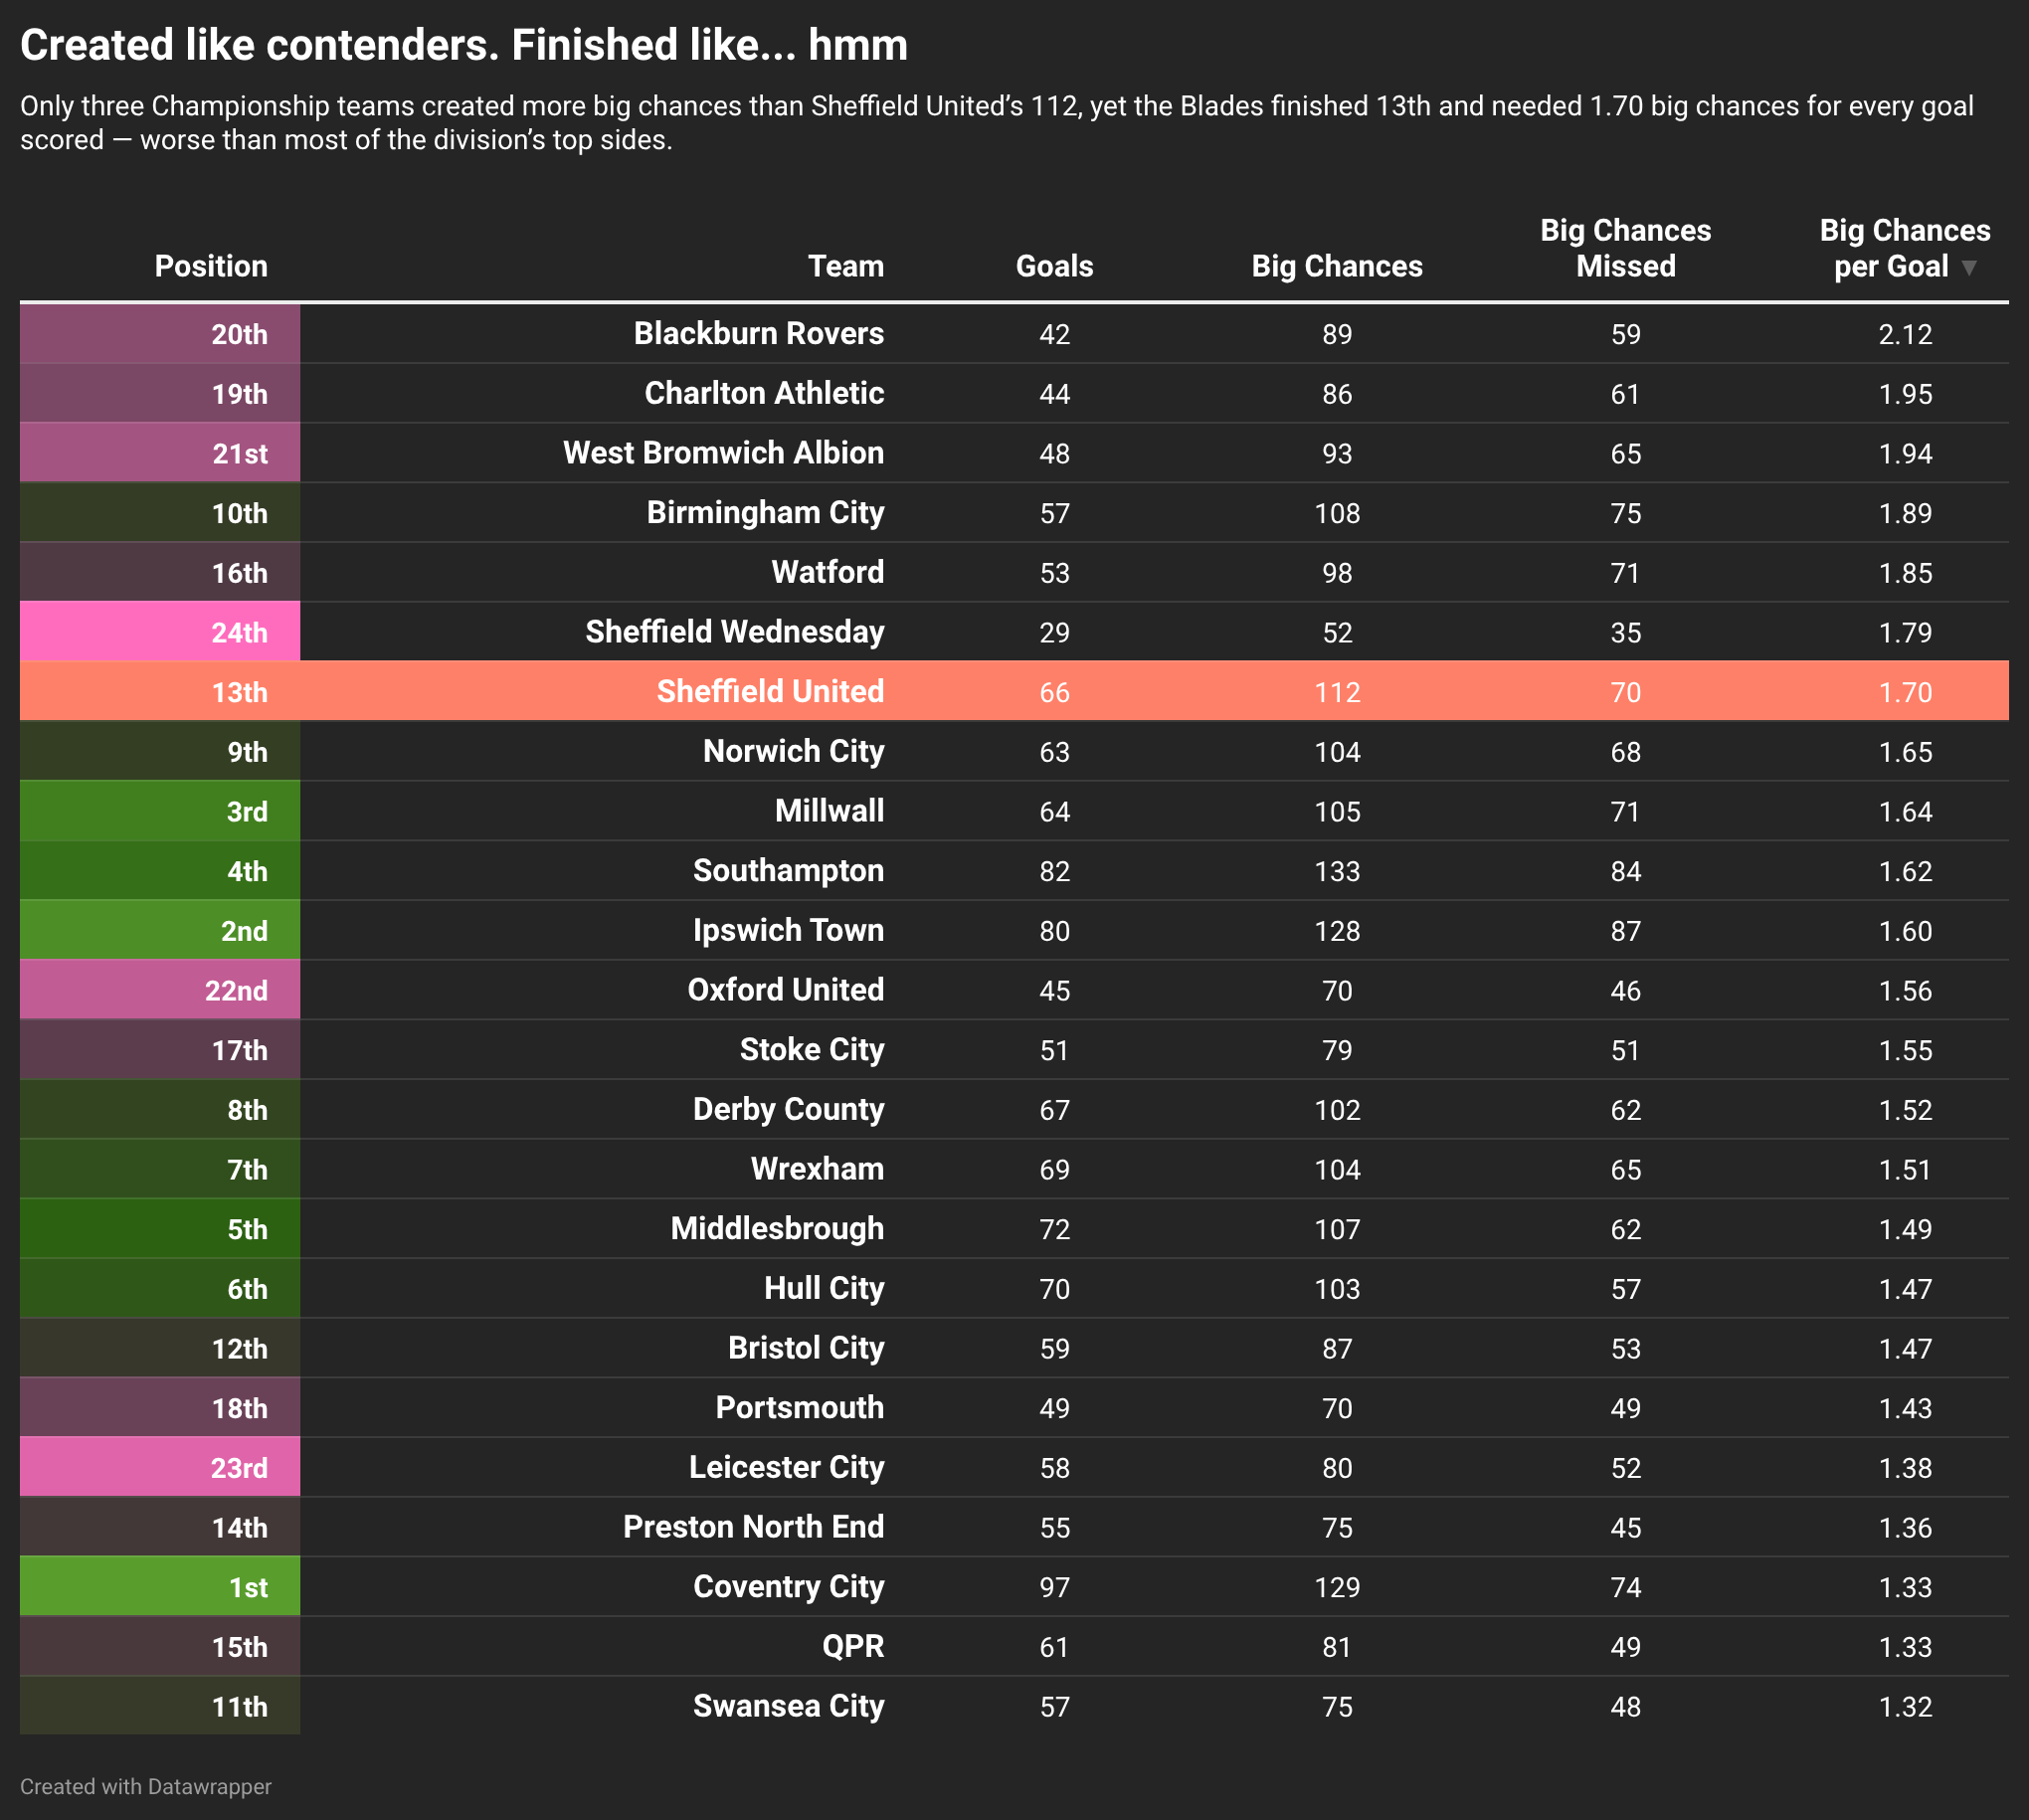
Many of the stats above paint us in a rather positive light. Perhaps too positive; the data jars with a general gut feeling that we weren’t dominant. Though I would argue that in some games – ultimately too few – we were.
The biggest issue is the smallest detail: we converted too few of our chances, though we created plenty.
Sadly, the reverse is not true. Opponents were pretty lethal, or if you like, Cooper and Davies were bad, which leads to the defence looking worse, because of course, when your GK barely stops shots, defences are more likely to make strange decisions. Oh, and some defenders were pretty honking, too. In short, we conceded too many from the chances we gave up.
And again, it comes down to small margins.
In a brilliant post by The Bladesman account here, you can see how, since August 2024, we’ve gone from a team that gives away few chances to a team that gives a little bit more.


Sheffield United, today, need more chances to score a goal, and our opponents need fewer. Part of that’s a natural regression after losing Anel Ahmedhodžić, Vini Souza, Kieffer Moore and Jesurun Rak-Sakyi. Another part is self-inflicted: buying poor players and players playing worse.
Let’s look at the chances we give away in more detail
3. Defensive Control
Where do shots against come from? Let’s repeat the earlier comparison:
🥅 6-Yard Box Allowed: ⚔️ Blades 10% | 🔵 Cov 7% | 🦊 Leicester 12%
📦 Penalty Area Shots Allowed: ⚔️ Blades 58% | 🔵 Cov 58% | 🦊 Leicester 57%
🚀 Outside Box Shots Allowed: ⚔️ Blades 32% | 🔵 Cov 35% | 🦊 Leicester 32%
Whilst the percentage differences look small, the number of shots allowed in the 6-yard box were eyewatering: 1 in 10 of our shots allowed (56) are taken from close range, versus 1 in 14 for Coventry (38). Simply, we gave away far too many clear-cut opportunities as a proportion of the chances against.
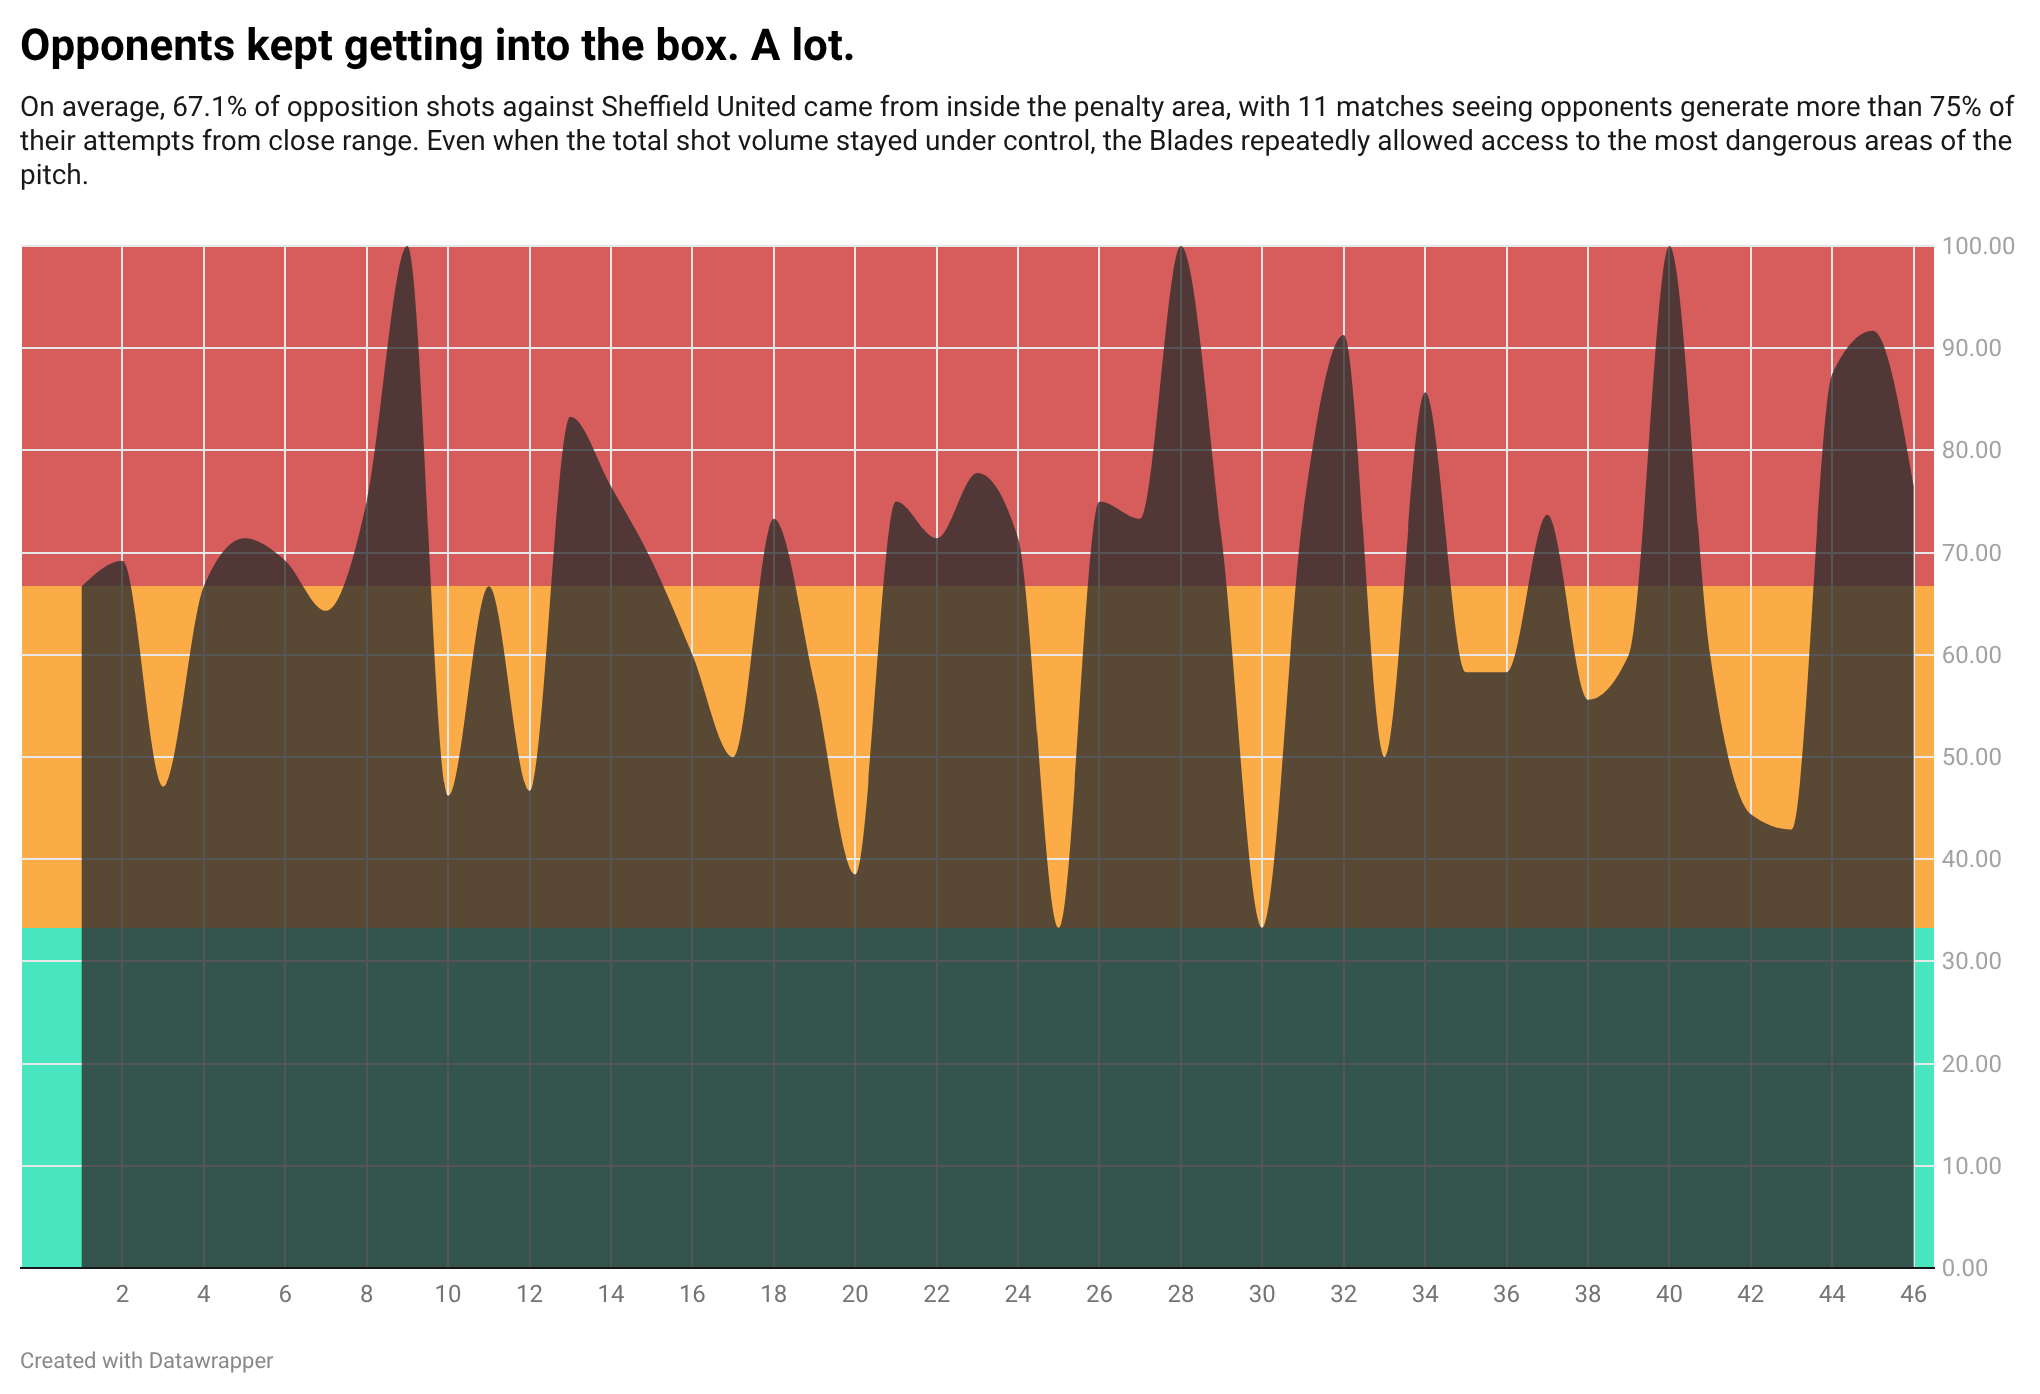
Now, it’s fair to say that, as a metric, “shots in box divided by shots” misses out a huge chunk of context. Sometimes, a team defends so well that the opponents fling crosses or launch long throws or whatever. There is such a thing as a bad opportunity in the box. But I’m not having that with us. We’re not a defence-first side who concede relatively few chances, meaning the opponent has to craft a good opening to get one at all. We allowed far too many good opportunities.
Now, when opponents do get their shots off, one long-running suspicion is that we are dreadful at getting ourselves between the ball and the goal. Blocking is a skill of athleticism and positioning, and fair to say, it’s one of the poorest parts of our game.
We can see this in the percentage of shots that we block versus how many of our own shots are blocked by opponents.
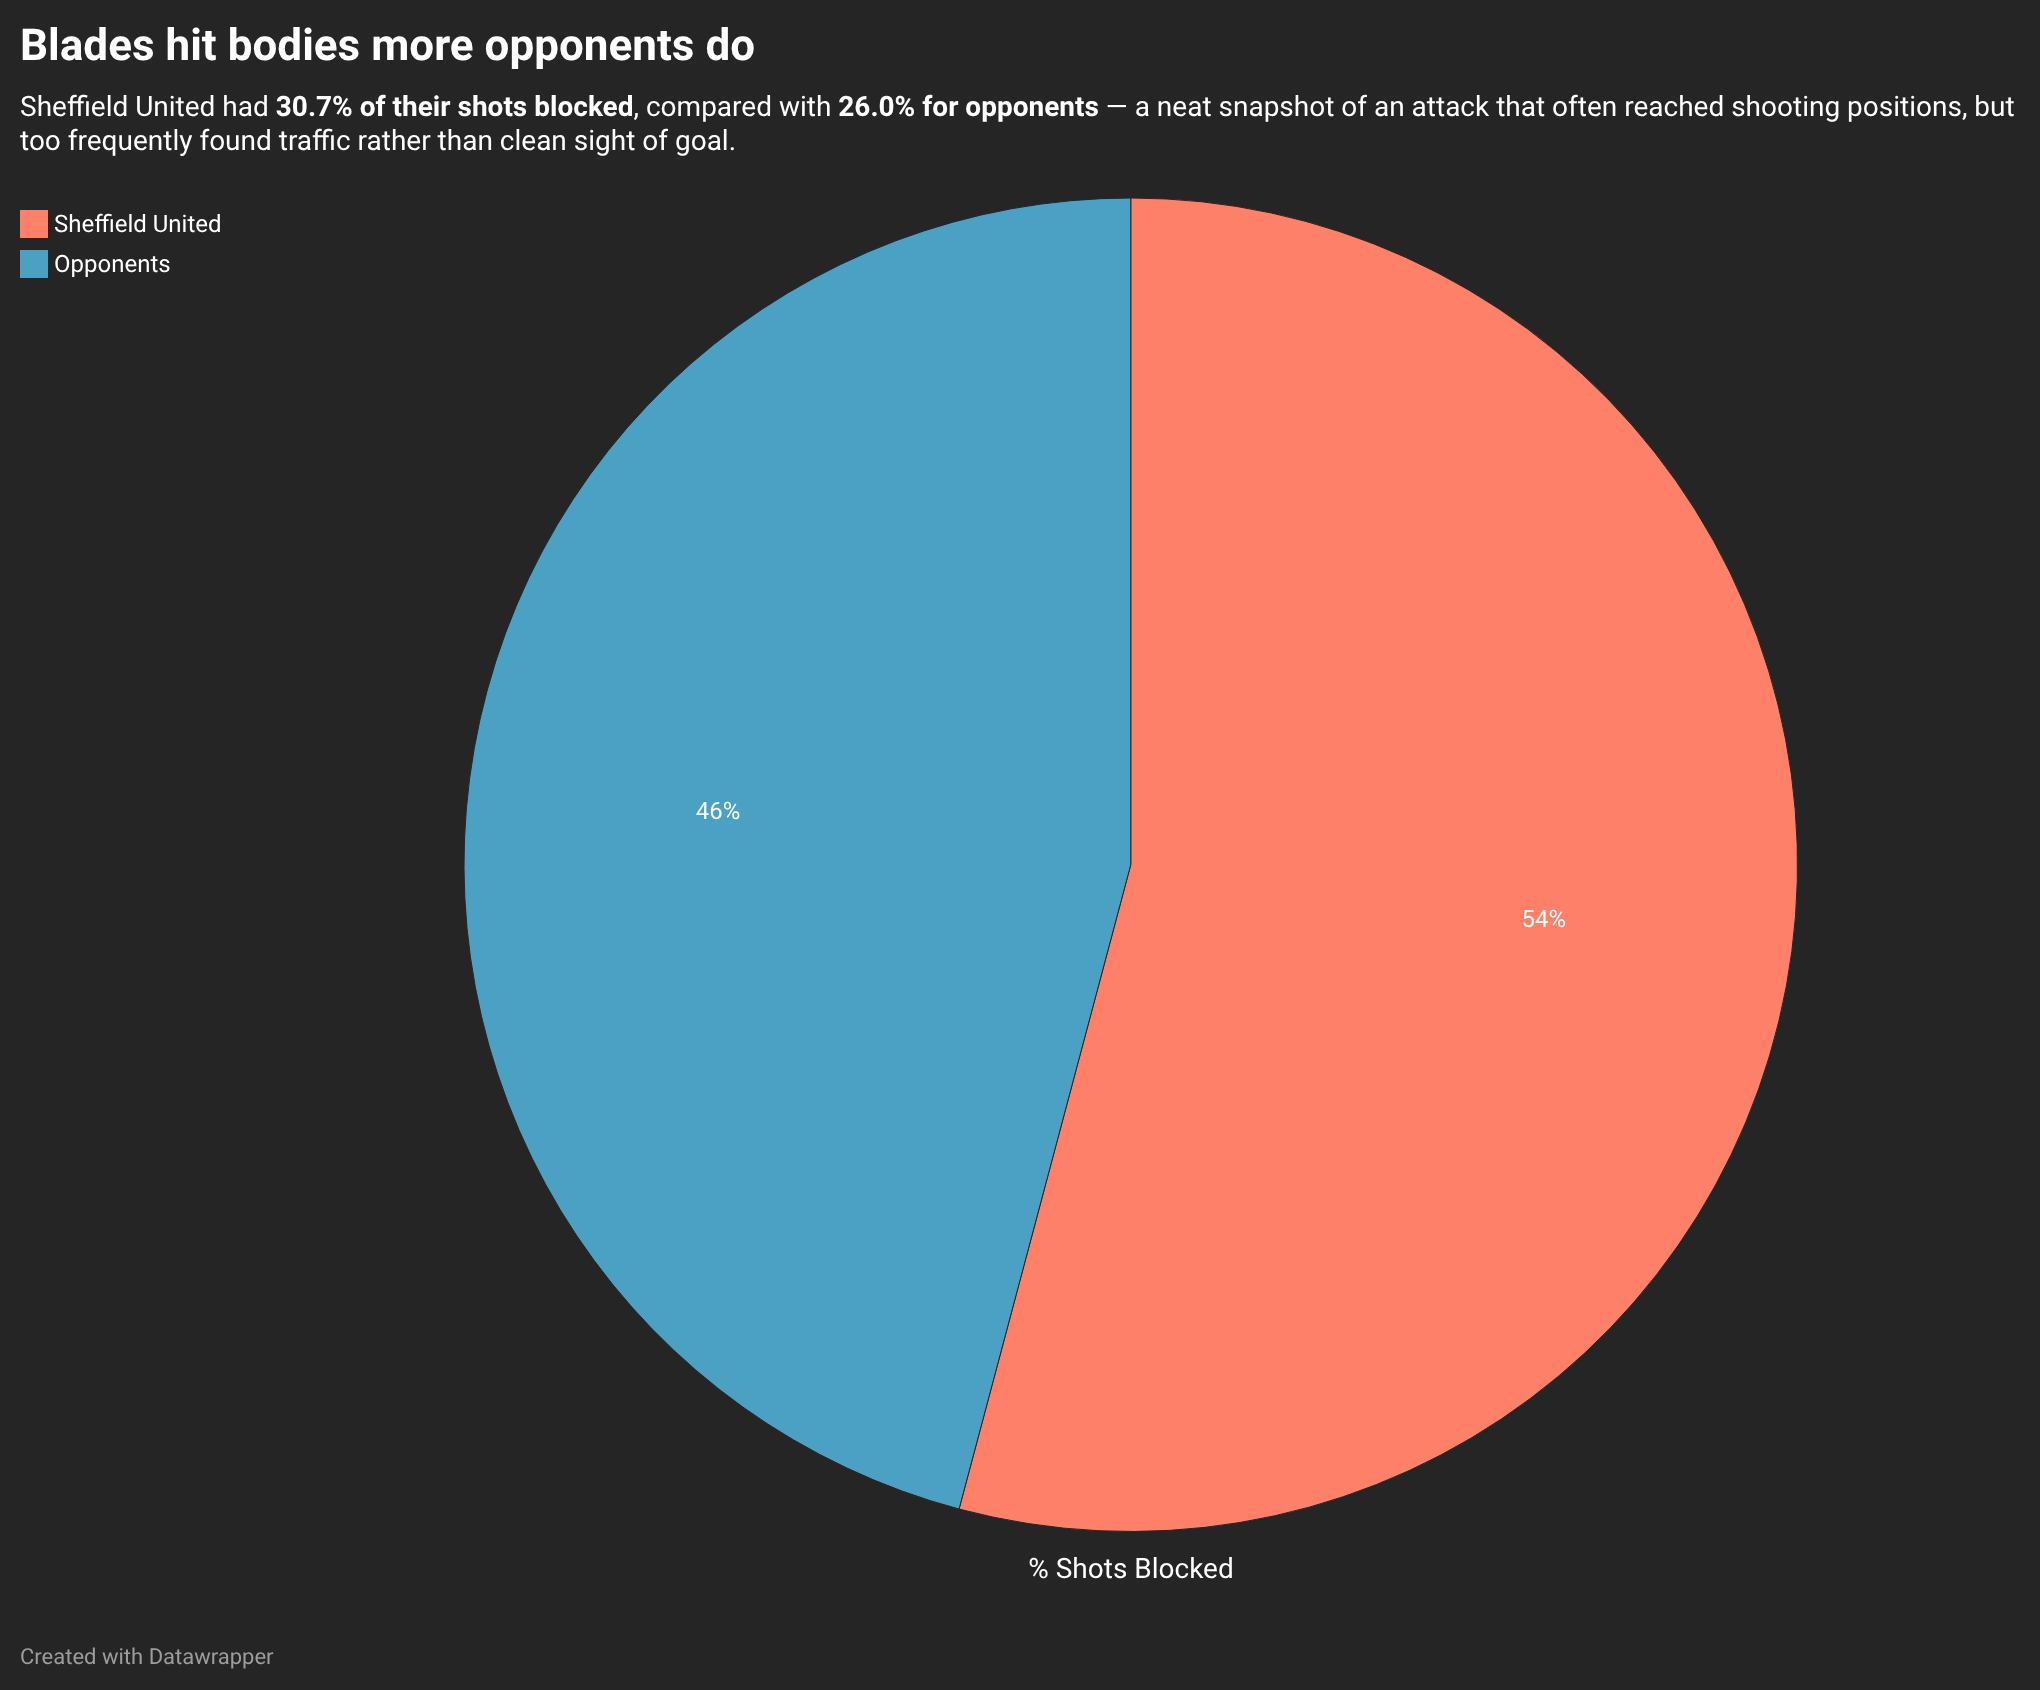
Blocking shots is a final act, though. And really, it speaks to both the fact that we take more shots than our opponents, but also that, where we take shots against settled defences, opposing teams tend to find bigger gaps in our defence.
The gaps are an interesting one. Because, in part, they are self-induced through a press that, personally, I enjoy. I want us to press. I also want us to press without shooting ourselves in the foot.
See Blackburn (1-3) as an example
1️⃣ After pressing a Blackburn clearance we win possession and Tanganga plays it straight back to them. They play the ball into the space vacated by Hamer.
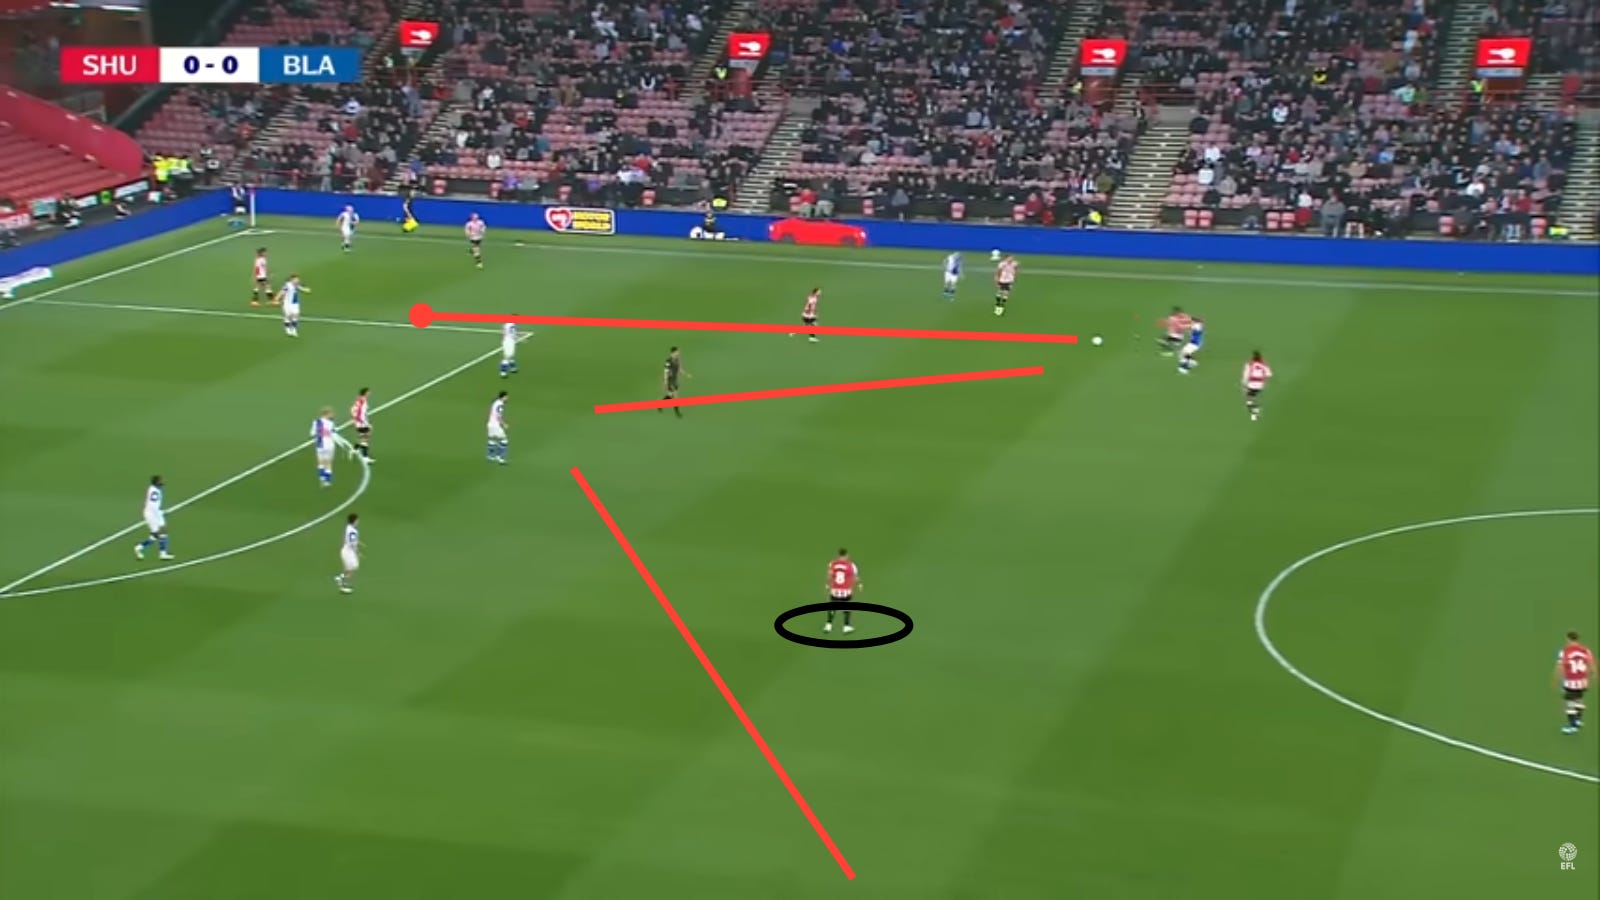
2️⃣ Blackburn’s outball finds their right-sided player, by which point only one centre-back is positioned in our own half. Tanganga out of position.
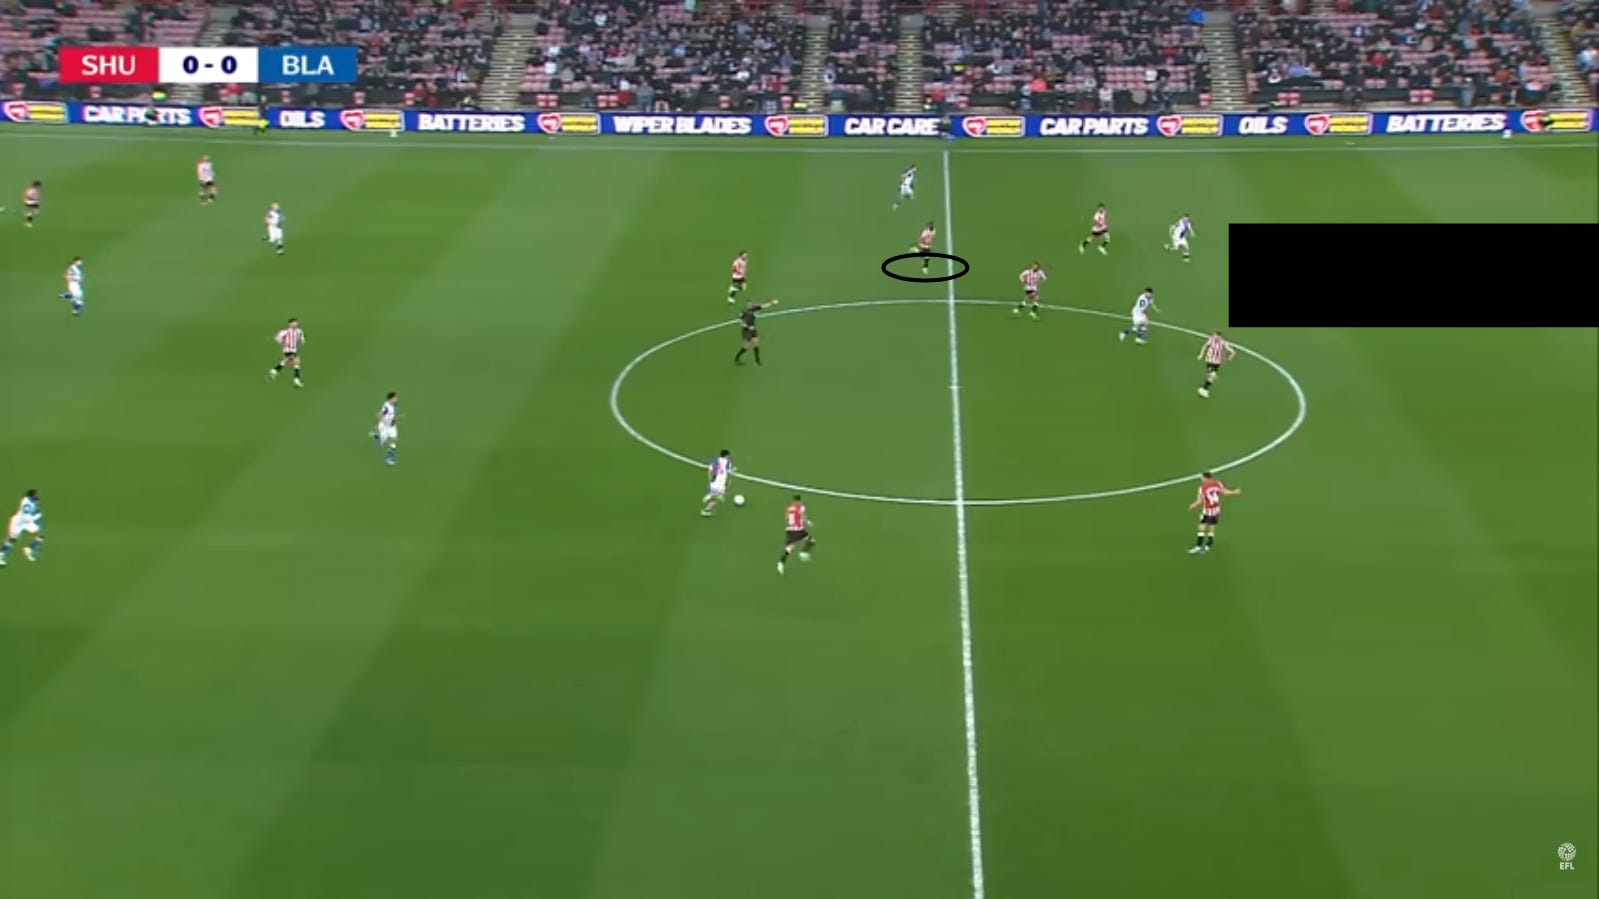
3️⃣ Tanganga is permanently behind play, though someone should have covered. Nobody has stopped the throughball. McGuinness is flat-footed. Burrows isn’t tight. And Hamer never got close to his man. The end result is a goal.
The point here is that opponents find space too easily, especially with Hamer and Burrows on the pitch (pray for McCallum). This space does not exist in a vacuum; when an opposition player finds a gap, our players respond to try to plug it, but it leaves another gap elsewhere.
It’s a common theme this season. We have conceded from 9 counter attacks, which is nearly 1 in 7 of all goals conceded.
Is ‘defending’ higher up the pitch good or bad for us?
Well, fair to say Sheffield United operated one of the Championship’s most aggressive and effective pressing systems. Only Middlesbrough recorded more “pressing sequences” – which describes breaking opponents’ possession through a press. As a proportion of all our defensive actions, 11 per cent were presses, which ranks as the highest in the division.
That pressure translated into:
331 high turnovers, the second-highest total in the league, of which;
59 ended in shots and seven directly produced goals
To me, this is a good sign. And I’d wager most fans prefer a blood and thunder press to a more static block. The issue, as far as this season goes, is that we have a squad cleaved down the middle between those who are natural pressers (O’Hare, Brooks, Seriki) and those who only ever seem to chase lost causes (Hamer) or else cannot shift in the middle of the park when we lose possession (Riedewald, Rothwell, Davies and to a lesser extent, Peck).
Ahead of the summer, it’s going to be interesting to see whether the profile of players we sign fits with a pressing style/transitional style or more of a controlled possession team. In 25/26, we’ve been caught between the two, to put it negatively. Or for a positive spin: we’ve been adaptable.
What I don’t like about this team is its versatility. Opponents find plenty of joy from any number of attacking strategies: open play, counter-attacks and set pieces.
4. Possession & Territory
There are two key questions I want to look at here. First, who keeps us ticking over and is responsible for regular build-up play as we move from back to front? Second, are there any correlations between passing numbers and results?
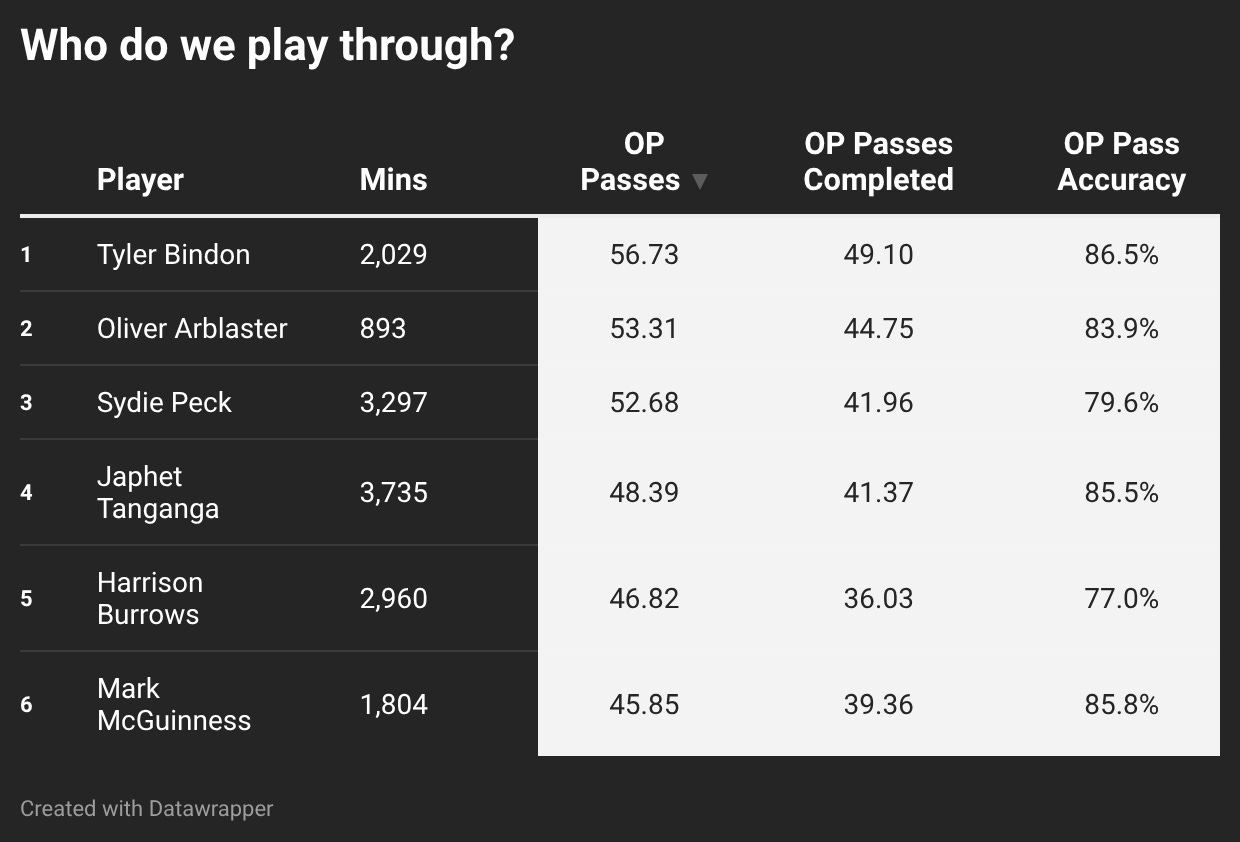
Among players averaging at least 45 open-play passes per 90, we find three types of high-volume ‘build-up merchants’:
Centre-Backs: Obviously, centre-backs tend to collect the ball from the goalkeepers, and are therefore more likely to make more passes than most. The above shows there’s a preference towards Tyler Bindon operating as the build-up merchant when he plays. He has a +8/+10 swing to Tanganga and McGuinness who are evidently less trusted.
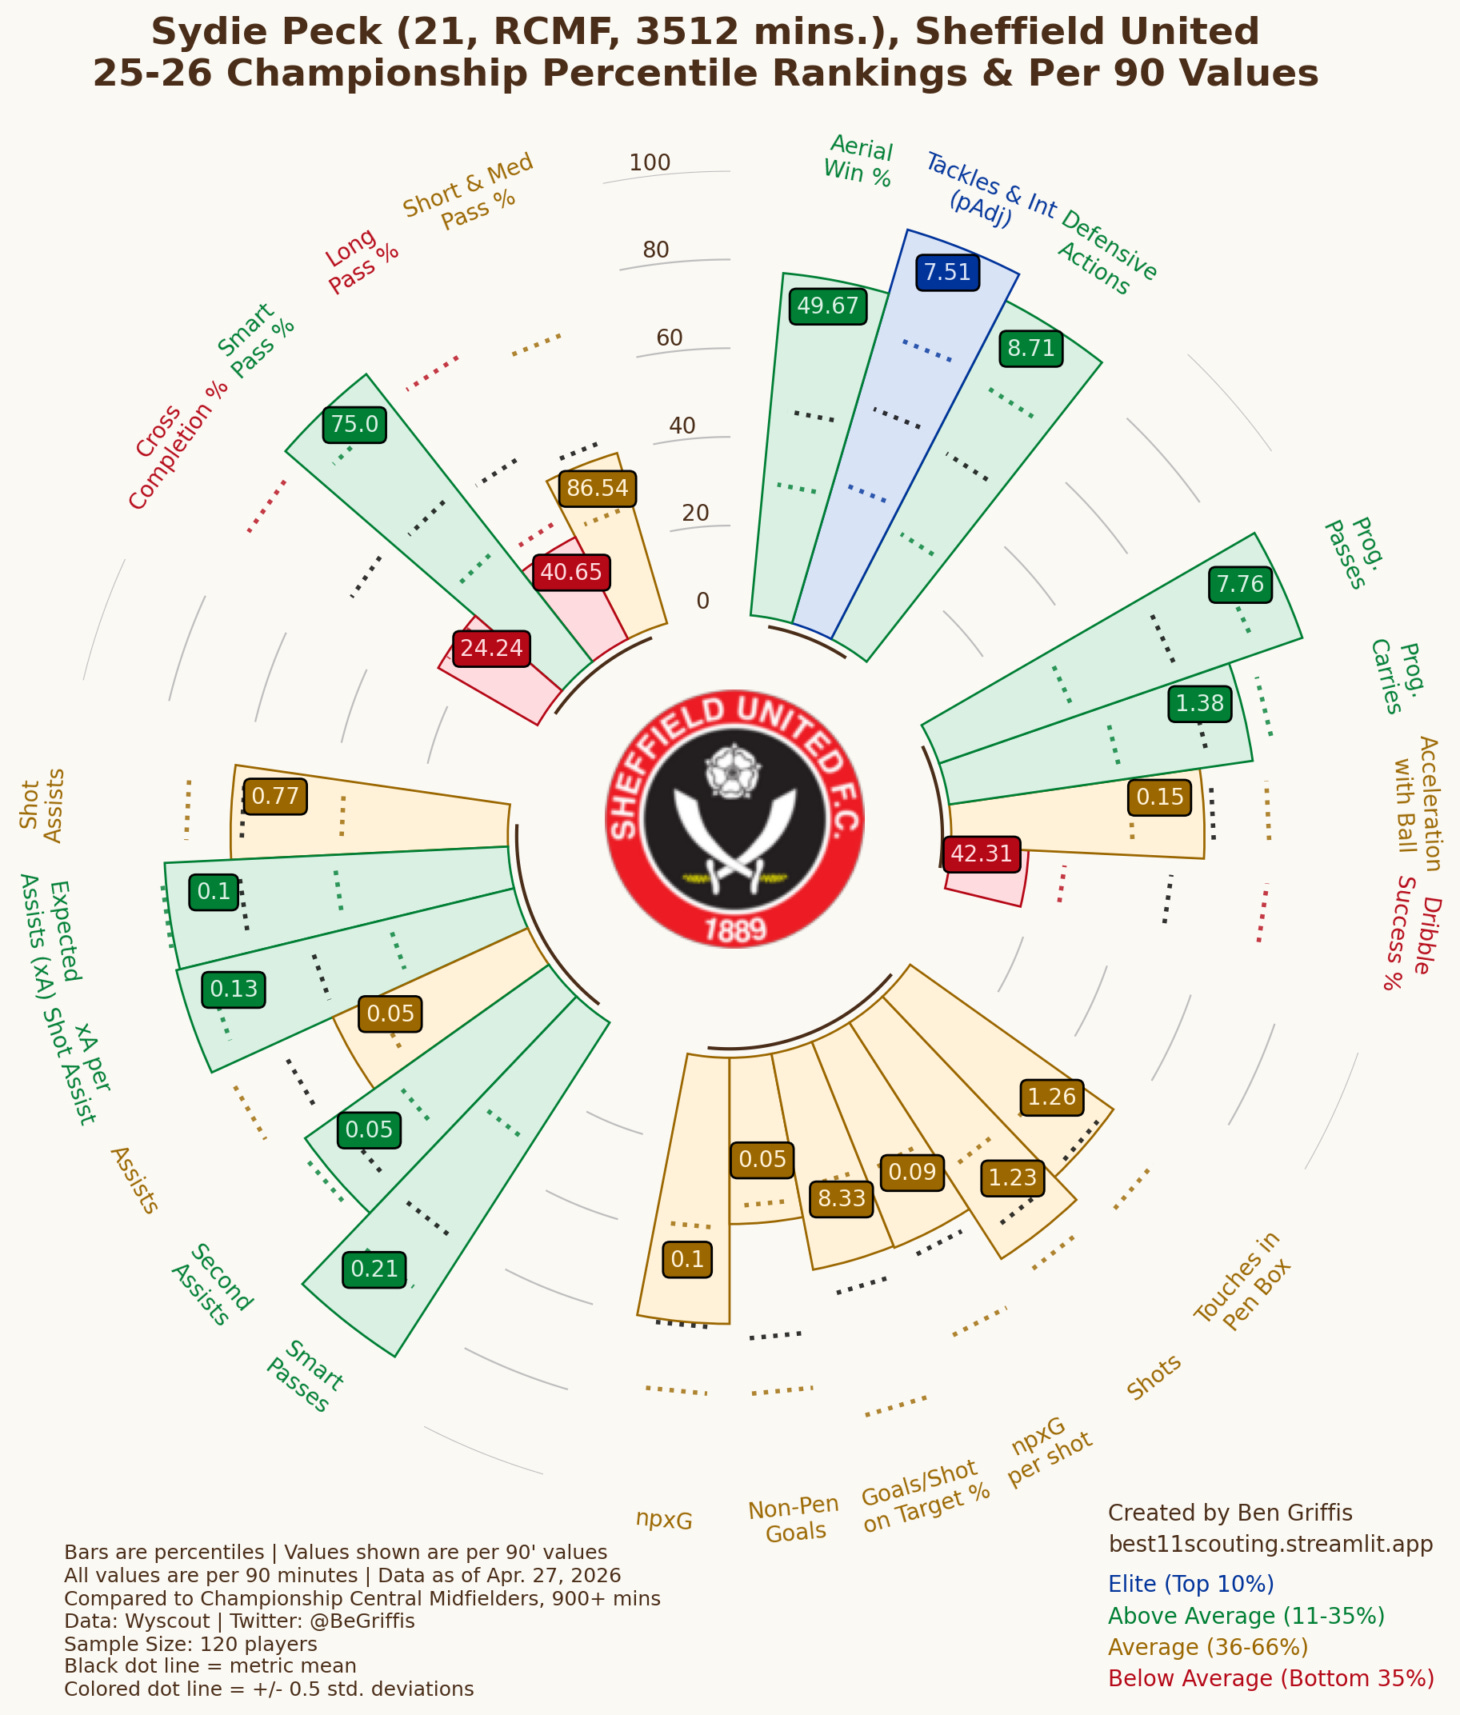
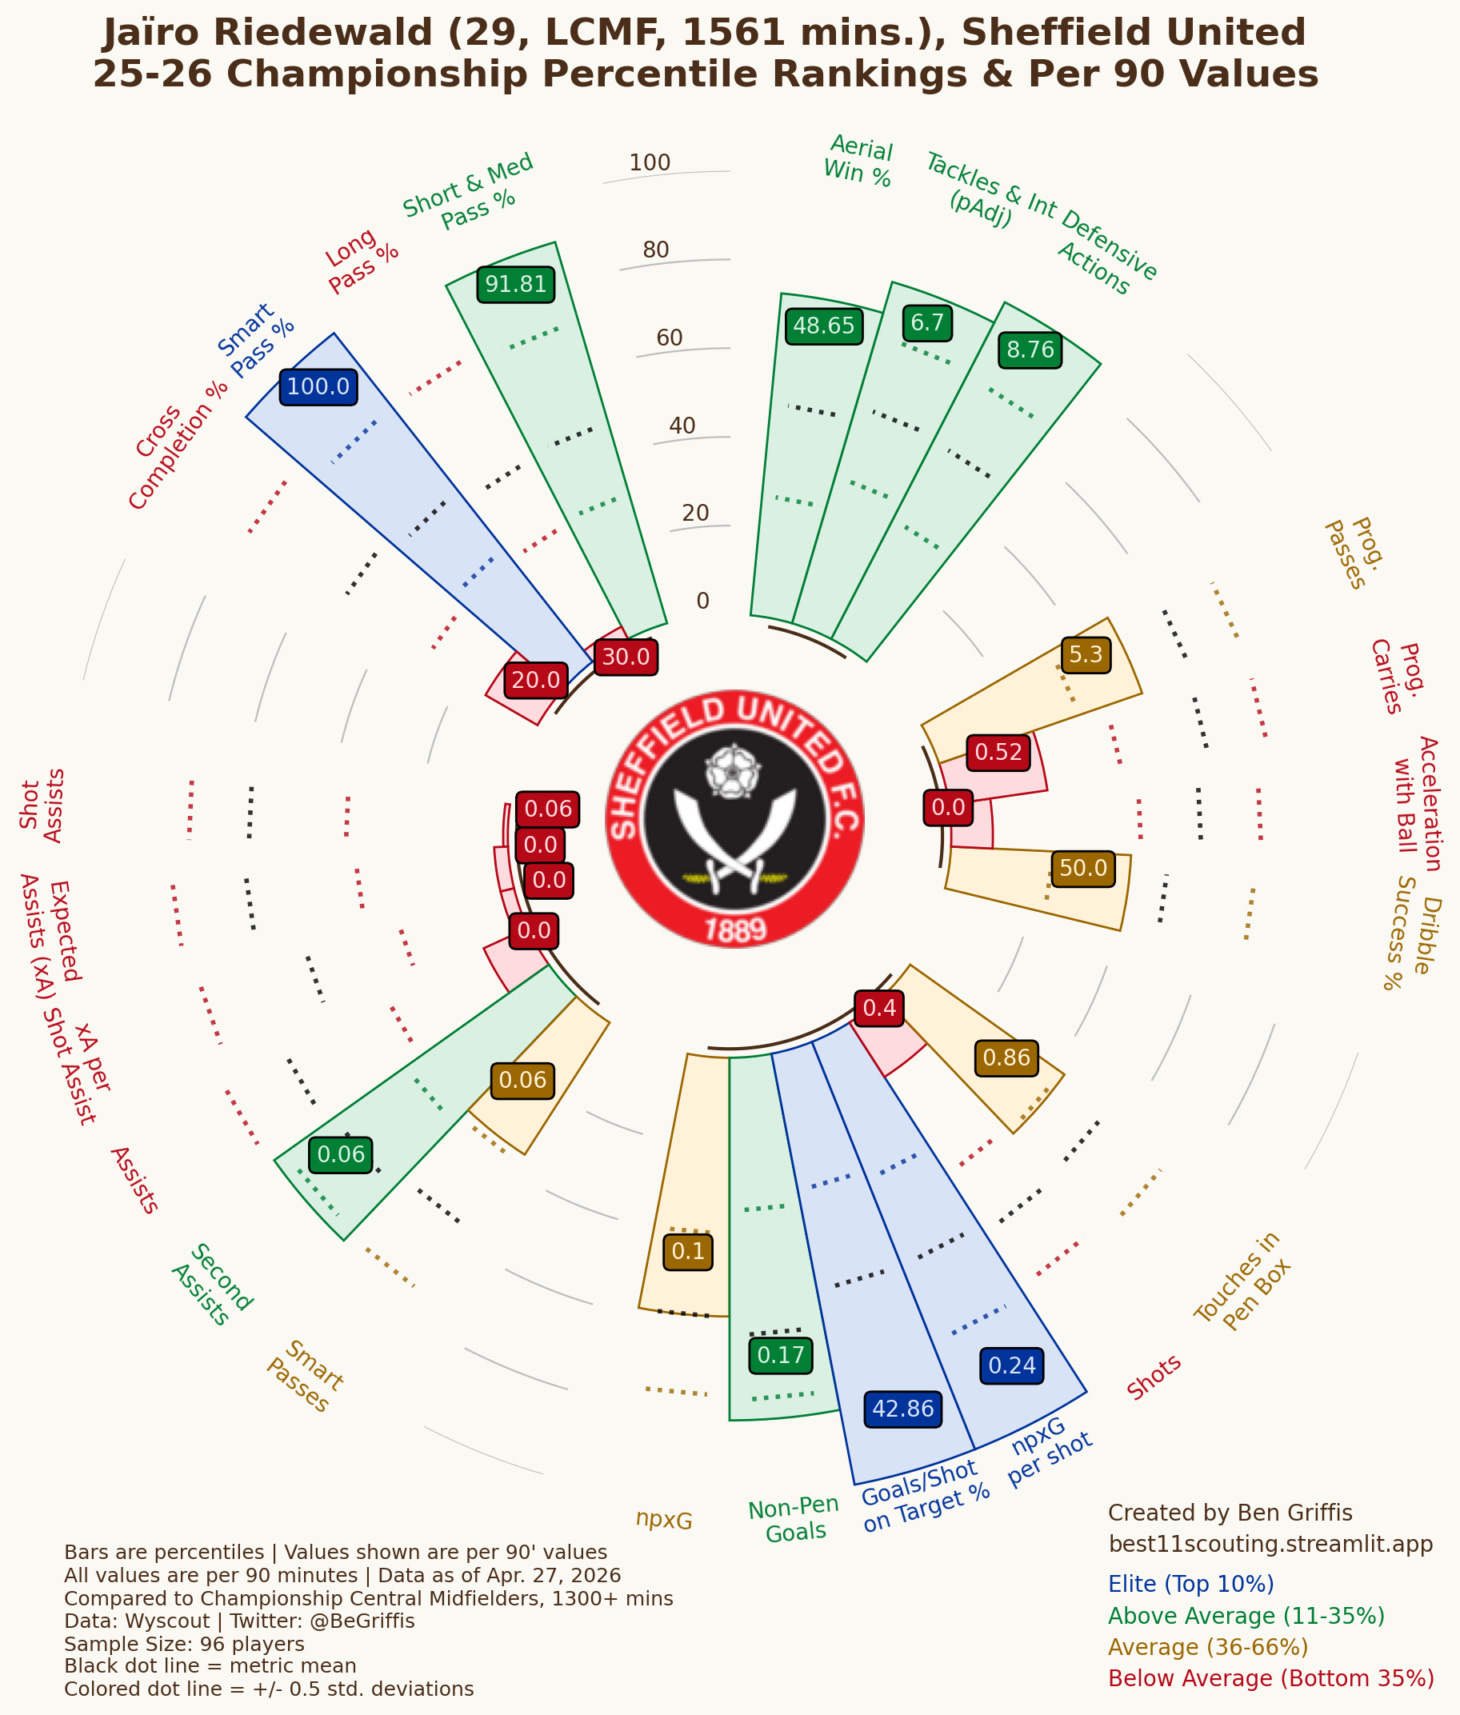
Centre-Mid: When Oliver Arblaster plays, his numbers sit alongside Sydie Peck in terms of volume. Both play a similar role when on the pitch (and arguably shouldn’t play together); they collect the ball and are trusted to distribute FORWARDS. You might wonder where someone like Riedewald fits in here. Just 1 in 5 of his open play passes comes in the final third, whereas it’s 1 in 3 for Peck/Arblaster. Jaïro shuttles; Sydie or Ollie are tasked with getting us into a dangerous position.
Ooh, a Left-Back: A full-back being used as a build-up merchant won’t be a common sight across the football league, but Harrison Burrows’ unique (some would argue limited) skill set allows us to attempt riskier, more direct passes. Burrows has an excellent left foot, and his distribution gives us a longer, similar-but-different-to-Norwood range when hitting channels or targets like Bamford. In that way, he offers something that our centre mids lack; that front-to-backness.
Of the players to make more than 45 open play passes per game, he makes the highest number in the final third.
So how does this figure in terms of our all-around possession?
By and large, we do well at keeping the ball in good areas. In 25/26, we averaged 52.4 per cent possession. This splits up into a broadly average pattern, again, more like the Champions than the relegation teams.
🛡️ Own Third: ⚔️ Blades 27% | 🔵 Cov 26% | 🦊 Leicester 30%
⚖️ Middle Third: ⚔️ Blades 41% | 🔵 Cov 42% | 🦊 Leicester 42%
🥅 Opposition Third: ⚔️ Blades 32% | 🔵 Cov 33% | 🦊 Leicester 28%
Spending more time in the opponent’s half is a perfectly sensible way to avoid conceding goals. That’s why we so often see the ‘horseshoe’ of passing from left to right, ambling in possession, as a defensive strategy. It’s an enduring motif from our last promotion season under Heckingbottom.
However, the “meta” in Championship football today, arriving a little later than it did in the Premier League, is transitions or counter-attacks. One in ten Championship goals (146) come on the break.
When more teams utilise a direct style of play, requiring fewer passes, to score an increasing proportion of their goals, I wondered about the number of passes it takes, once a team is in the opposition half, to earn a touch in the box.
Here we see that metric (opposition half passes/touches in the box) on a match-by-match basis during Sheffield United’s losses this season.
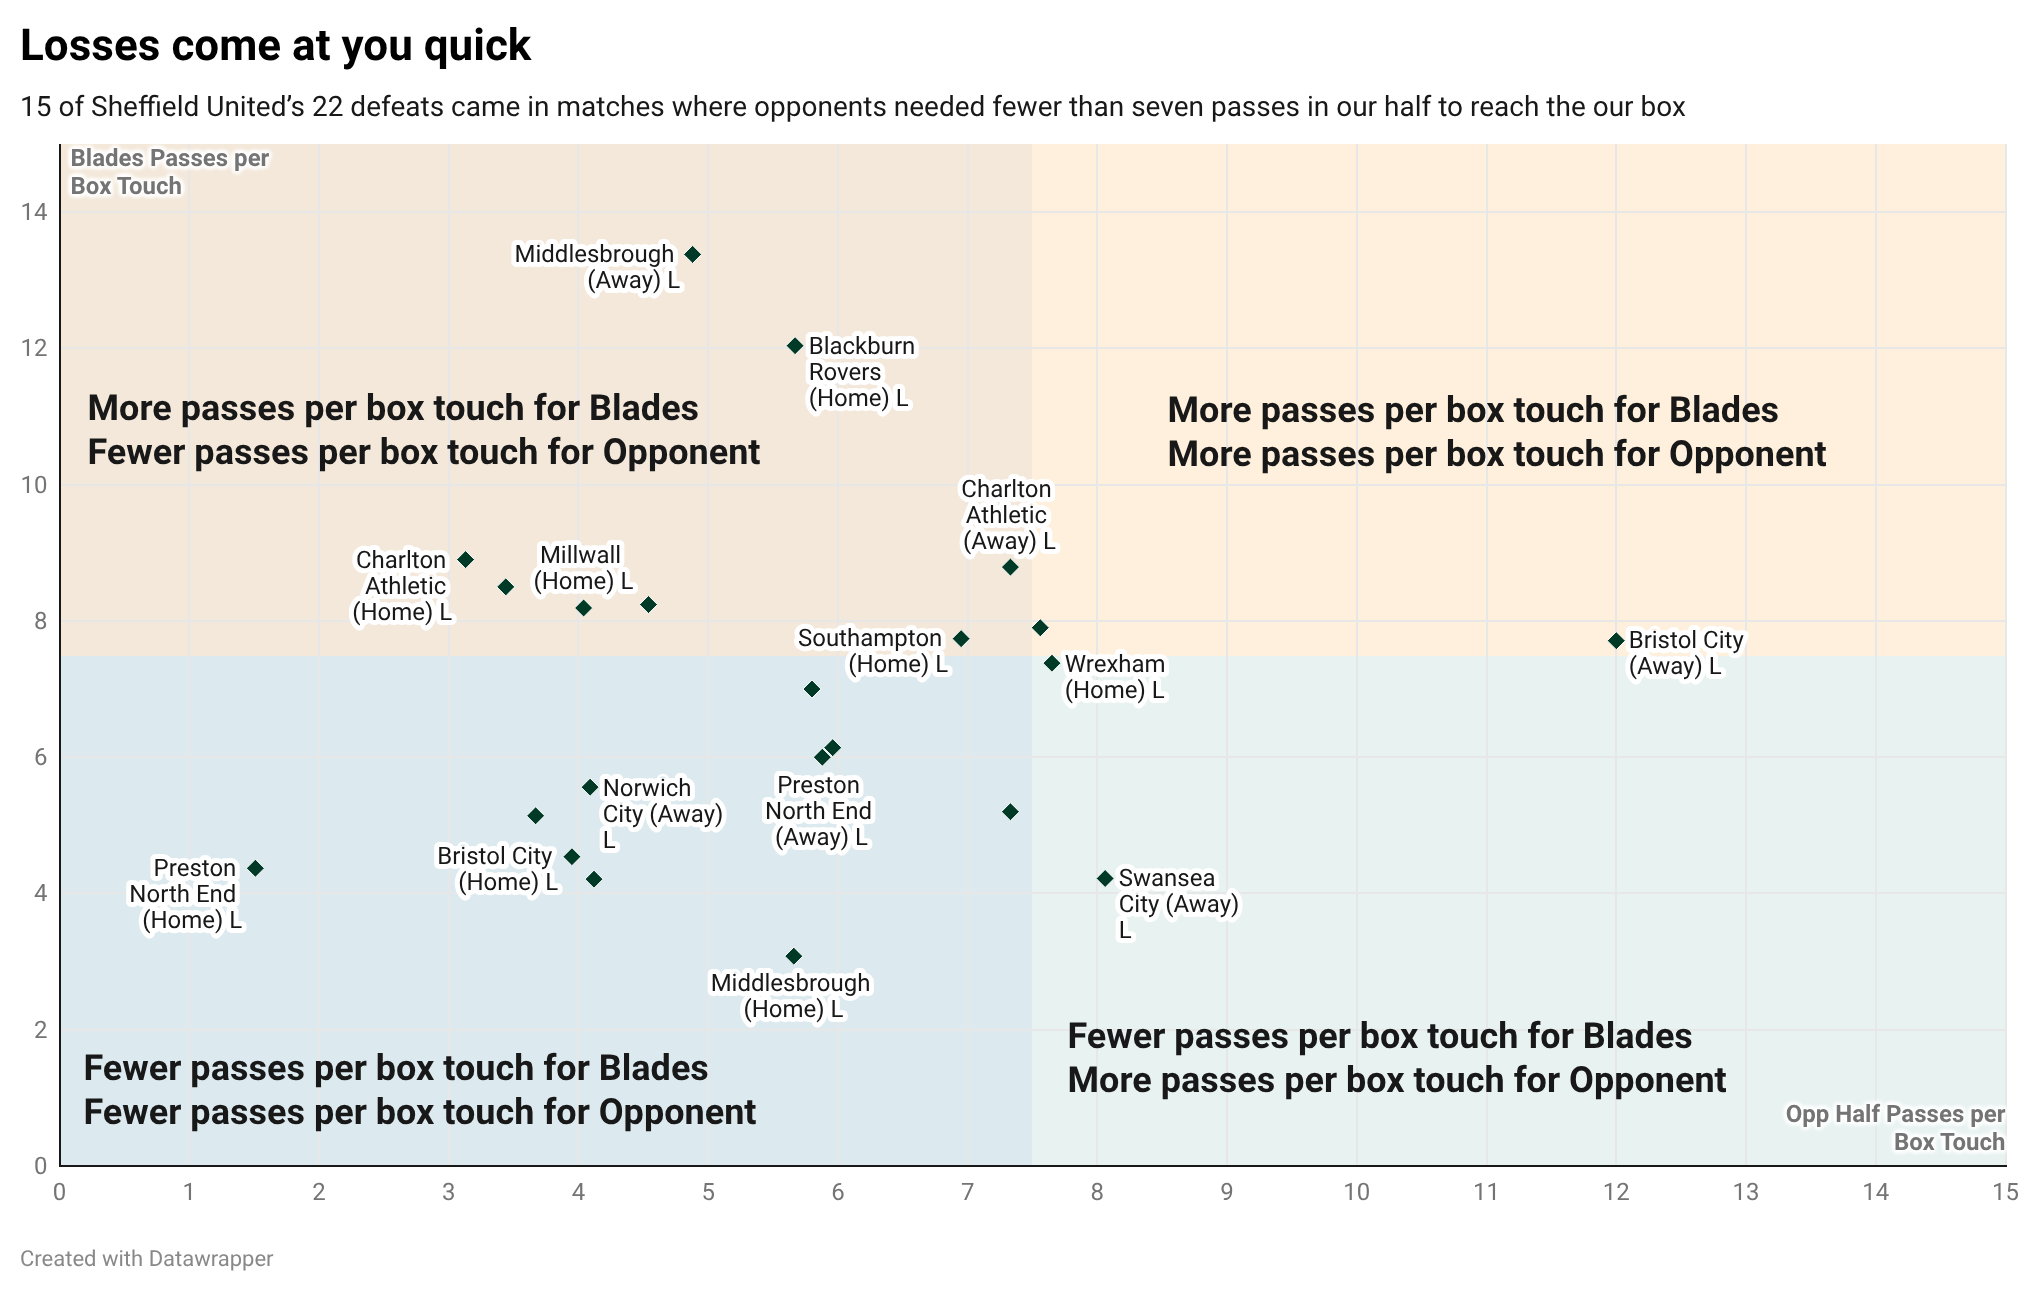
Teams in the Championship are taking fewer passes to create more chances, and it’s no surprise that most of our losses come when teams move the ball quickly in the final third. Part of that is on the opponent. Another part is down to our inability to defend transitions due to being slow. Another part is down to bad individuals.
What about when we win?
Do we tend to pass more quickly in the attacking half?
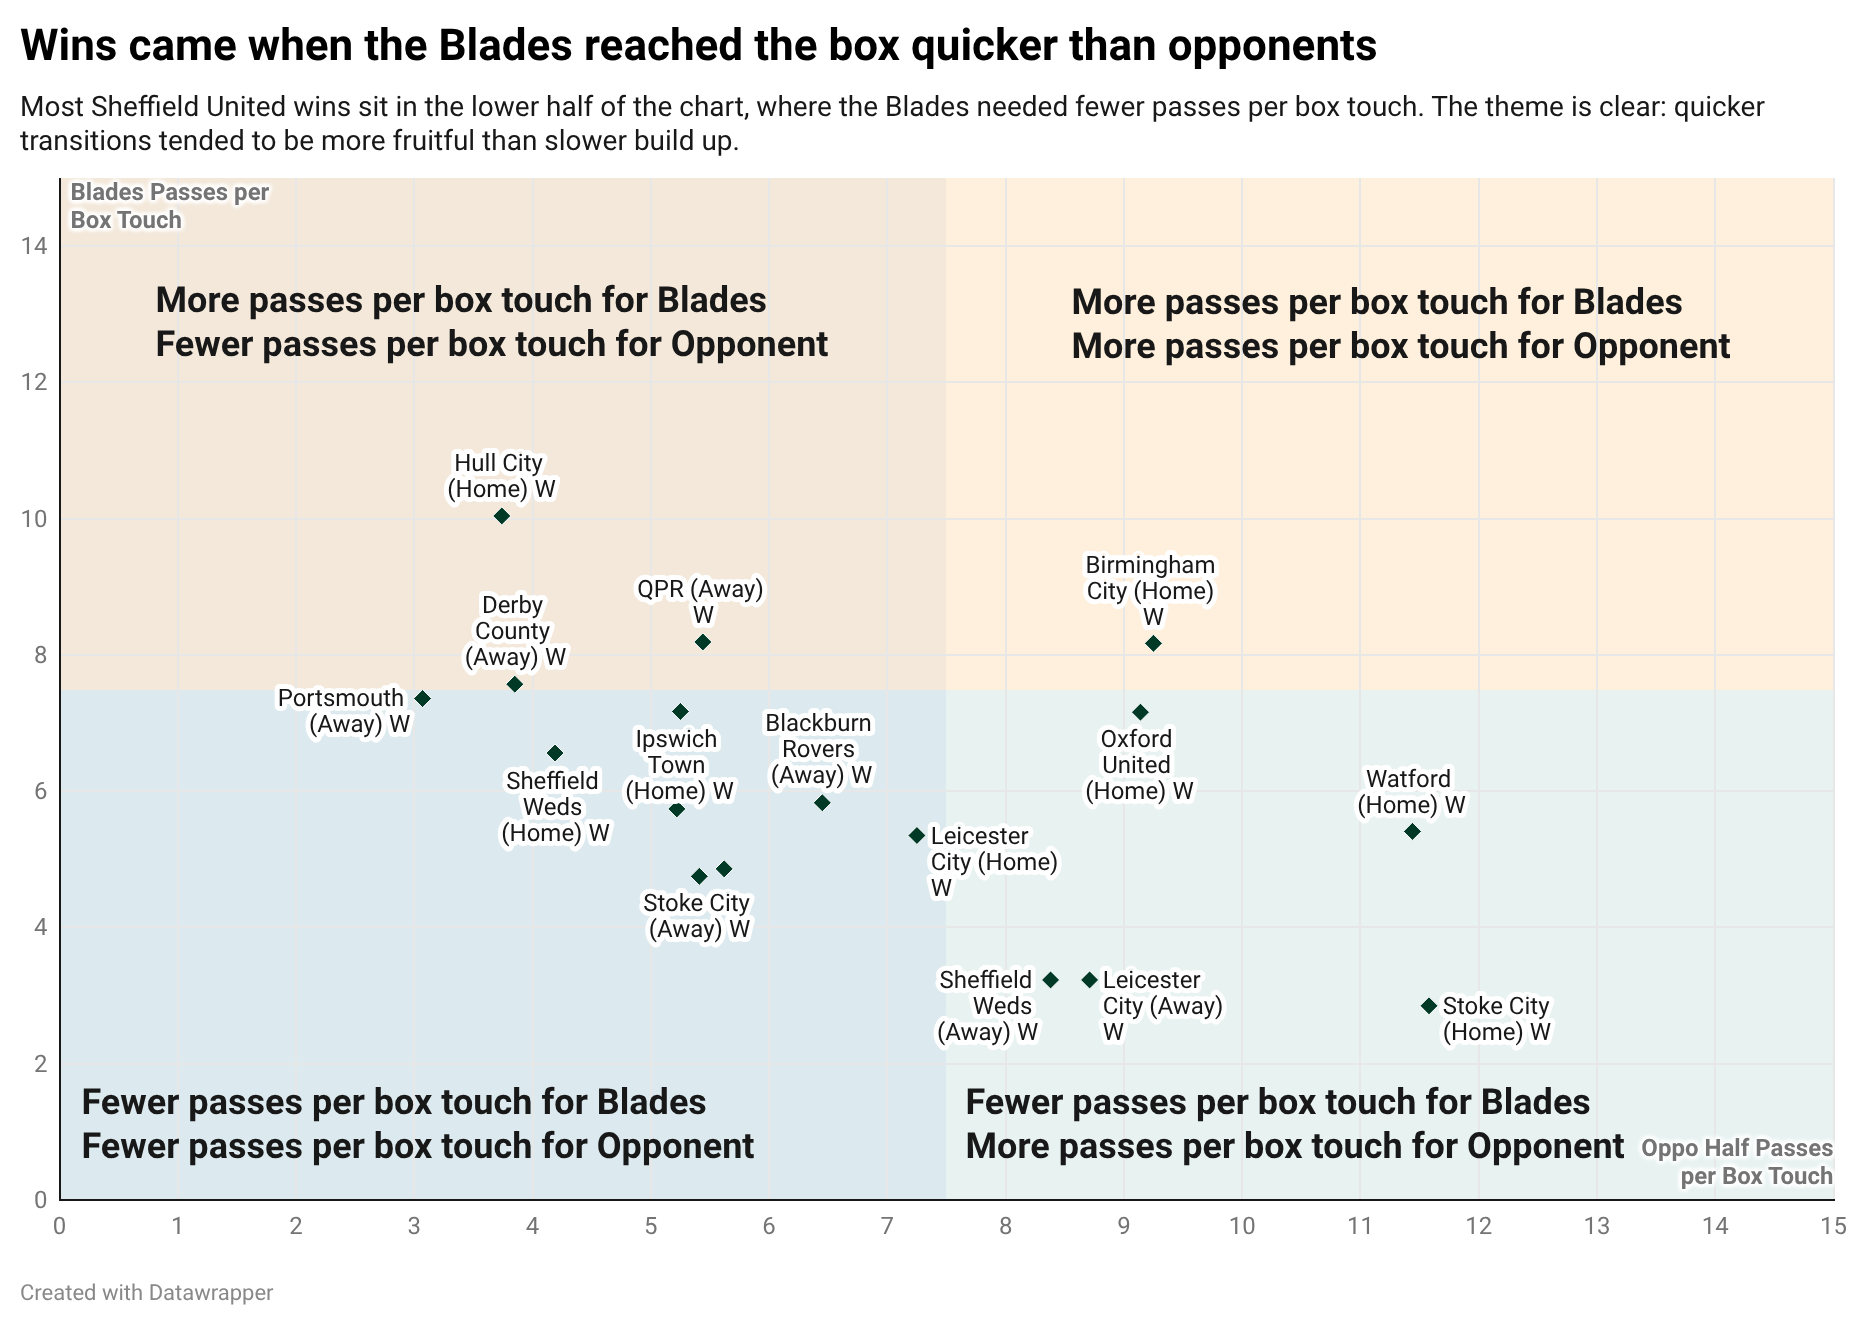
All but four of our wins came in games where, on average, we took seven or fewer passes to return a touch in the opposition's penalty area. There have been some great passages of play this season; snappy, one-touch stuff. Not all of it comes off, but it’s a symptom of this side playing at its best. The stodgier, possession-heavy stuff allows teams to settle into a block; that’s us at our worst.
Which leads me onto possession itself. Do we enjoy it? Do we win more games when we have more possession?
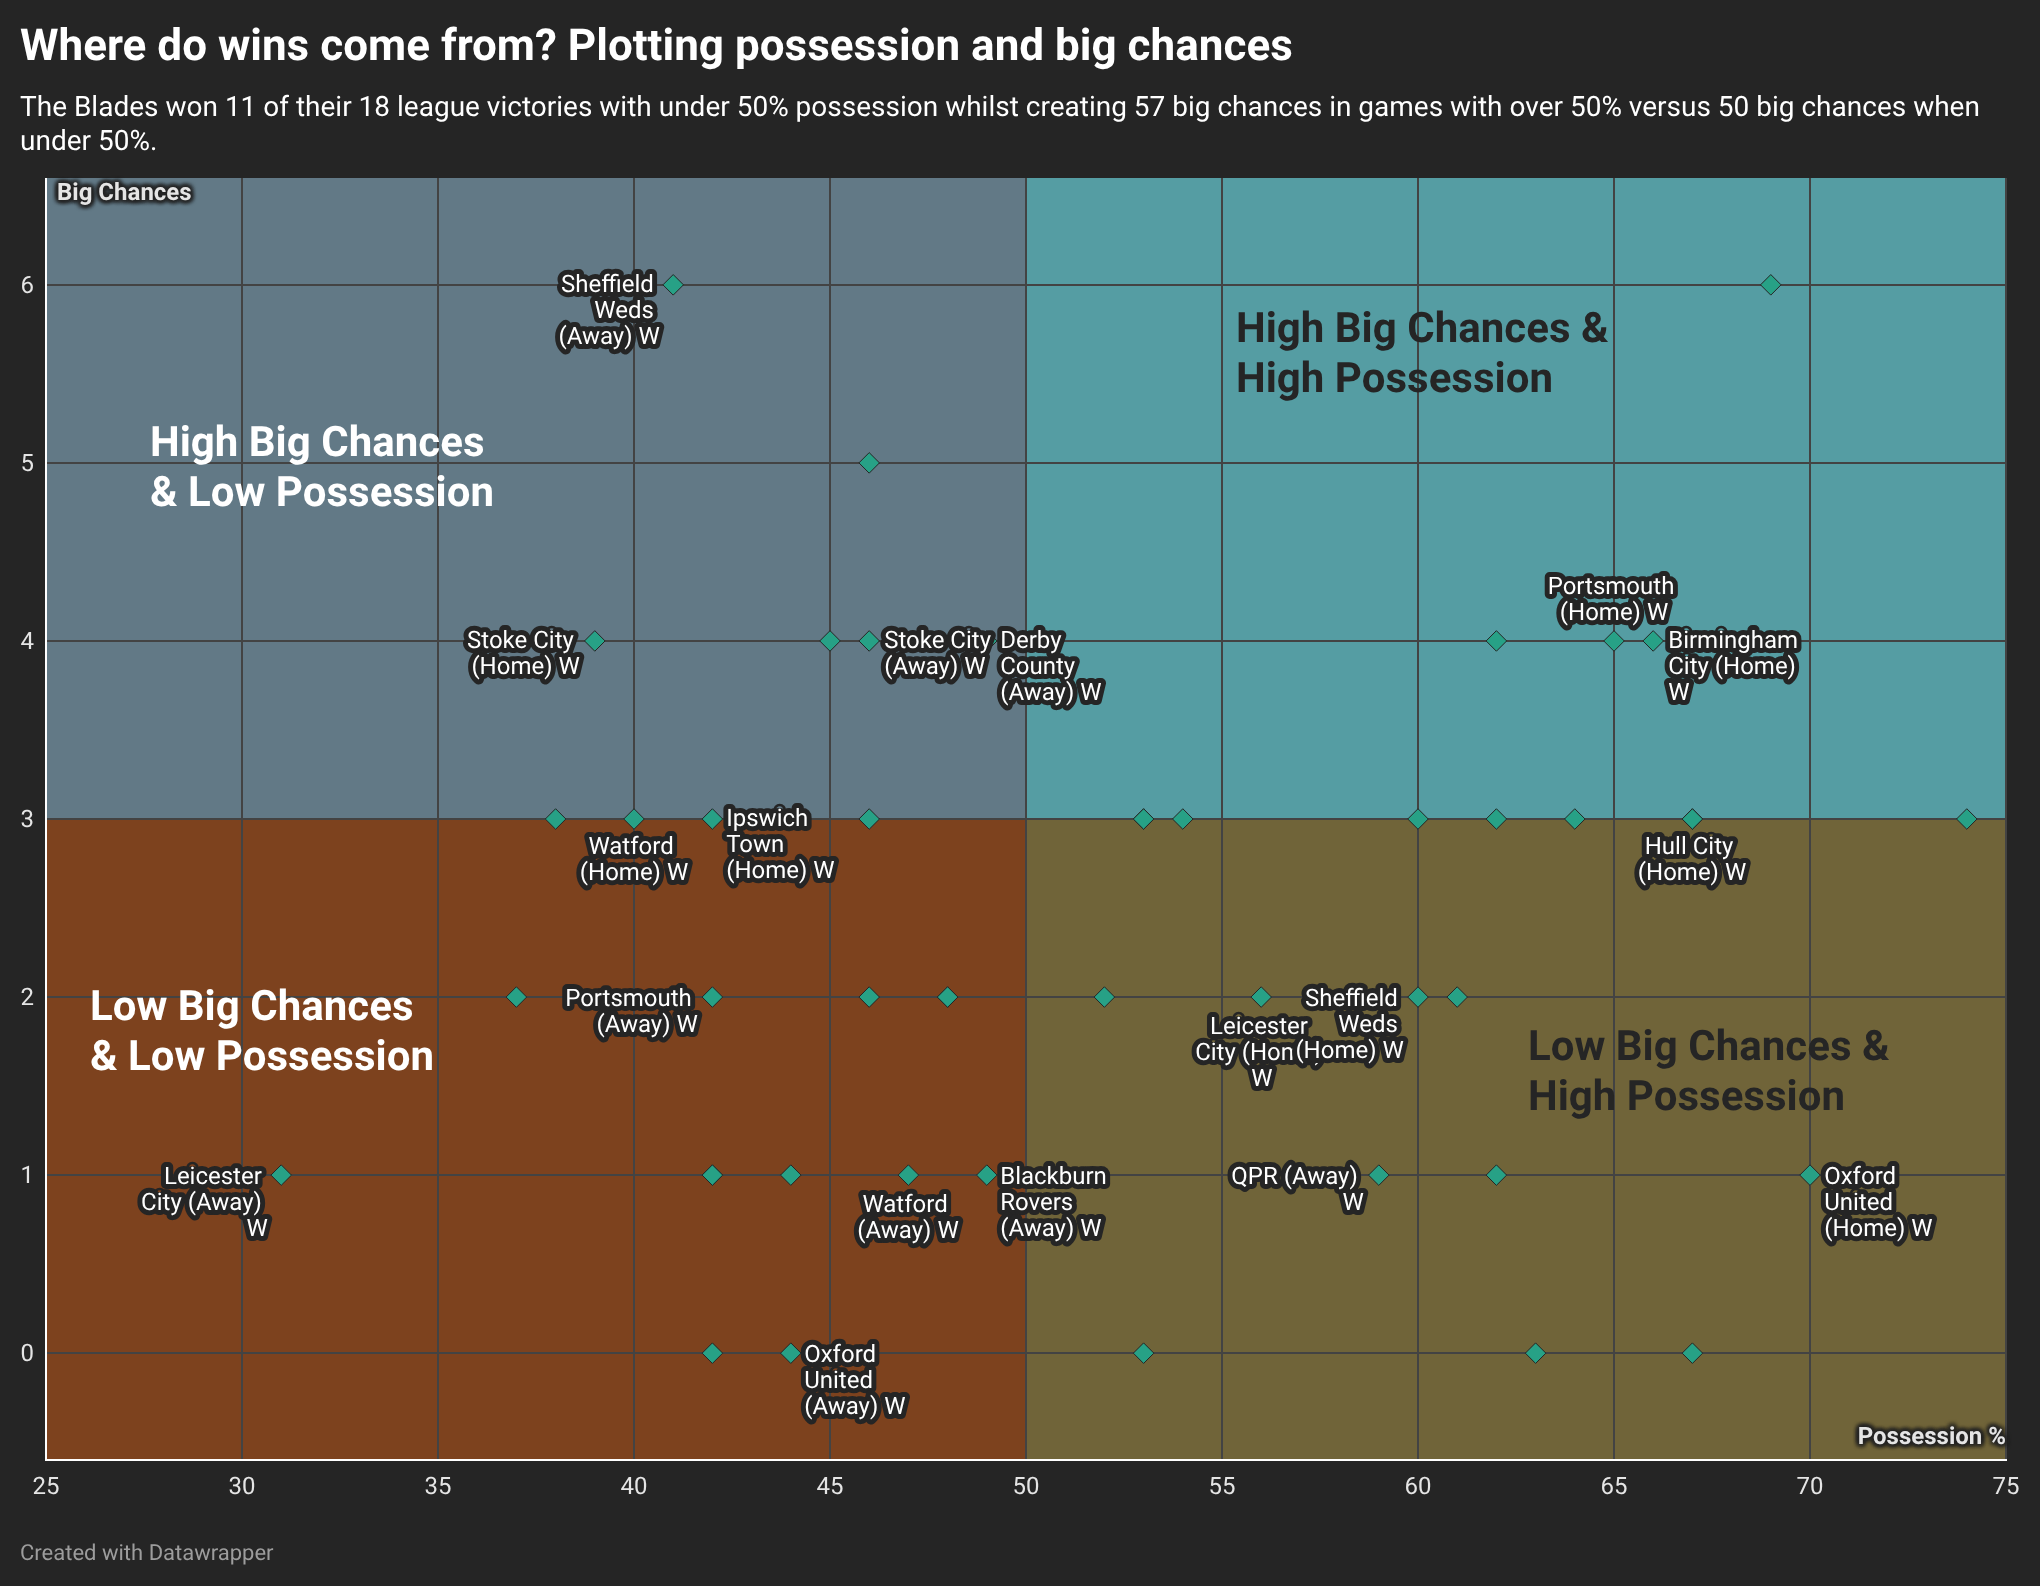
We have a fairly strong win bias towards games where we have less than 50 per cent possession. In fact, we only won four games with 65 per cent possession or more.
That said, I don’t love possession as a statistic because, more than xG, it abandons context altogether. What really makes the difference in possession (unless you’re Arsenal or PSG) is not style or tactics, but game-state. If you’re winning, you’re more likely to sit off, and your opponent is more likely to risk more men in advanced positions. In evenly-matched games, the scoreline changes depending on who has more or less of the ball. This is way more interesting to me, and way more revealing of this Sheffield United team’s deficiencies.
5. Game-State Behaviour
When goals change game-state
Sheffield United’s goal-state profile is a weirdly revealing one: we’ve been a terrible “reset” team. Only six of our 66 goals were equalisers – 9.1 per cent, the lowest figure in the division alongside West Brom. When games got away, they often stayed away.
That was also the case last season, but mostly because we took the lead in a huge majority of games. Not quite the same this term. But yes, our goals were much more likely to either put us in front or stretch a lead:
31 to take the lead
29 to increase our lead, or reduce an opponent’s lead
Defensively, United also conceded plenty of goals that changed game-state, with our opponents scoring:
28 goals to take the lead
13 equalisers
25 goals that increased or reduced a lead
That fits the broader theme of a side with pretty good underlying attacking numbers but lacking… what? Momentum, scruff-of-the-neck-stuff, bottle, guile? Once matches tilted out of our favour, we struggled big time. This is undoubtedly a fragile team.
And so, when Chris Wilder talks about experience (which is not, in my view, the same thing as age), I do see logic there. It is abundantly clear that this version of Sheffield United struggles not simply to fight back in adversity – because that is always tough – but to hold leads.
Goal Times
The timing data tells a similar story. United scored 30 first-half goals and 36 second-half goals, so the attack actually improved after the break (it usually does for most teams in any league).
But the defensive drop-off was stark: we conceded 25 before half-time and 41 after it, including 19 goals between minutes 46–60, our worst single 15-minute spell of the season. That post-half-time vulnerability is one of the clearest explanations for why strong attacking process did not translate into a stronger finish. Intangibles again. What on earth was going on at the break?
United were, however, strong starters. We scored first in 25 of 46 matches, which was joint-third in the division behind Coventry and Hull, and level with Ipswich, Middlesbrough, Millwall and Southampton. Look at those names: scoring first is the mark of a top team – except for us. That makes the season feel less like one of poor starts and more like one of poor control and arguably, poor individuals.
What about the individuals?
6. Individual Impact
Let’s begin with the lack of impact and the 14 players (not including Jack Robinson and Rhys Norrington-Davies) who played fewer than 1,000 minutes each and contributed a total of three goals and three assists.
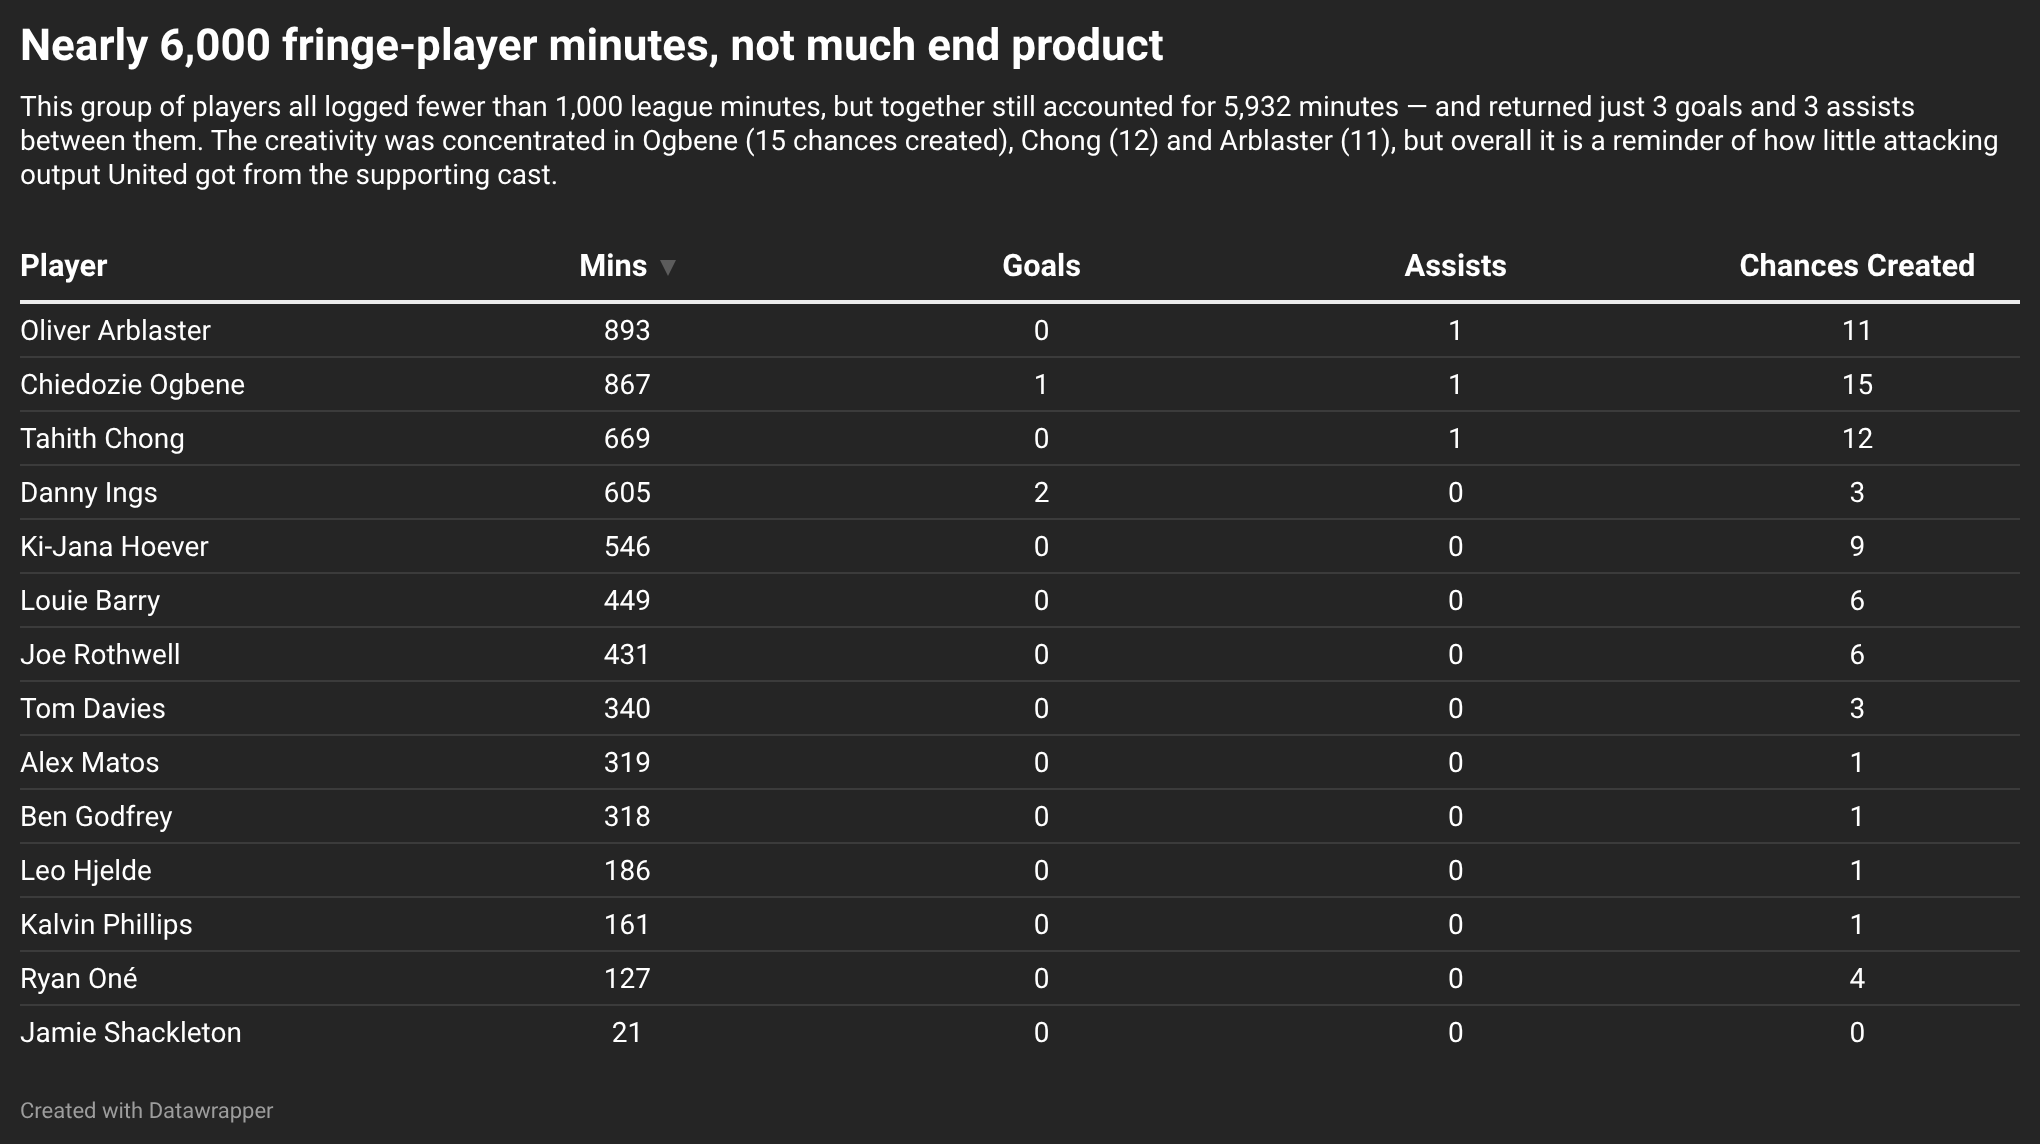
As Churchill once said, never in the field of human conflict was so little achieved by so many for so few. Or something like that. Between them, these players racked up almost 6,000 minutes, or the equivalent minutes of Callum O’Hare and Gus Hamer combined. We should never, never, never forget that this movie showcased some terrible cameos. Those small contributions add up to so much.
Anyhow, the SQUAD.
The players with 1000+ minutes
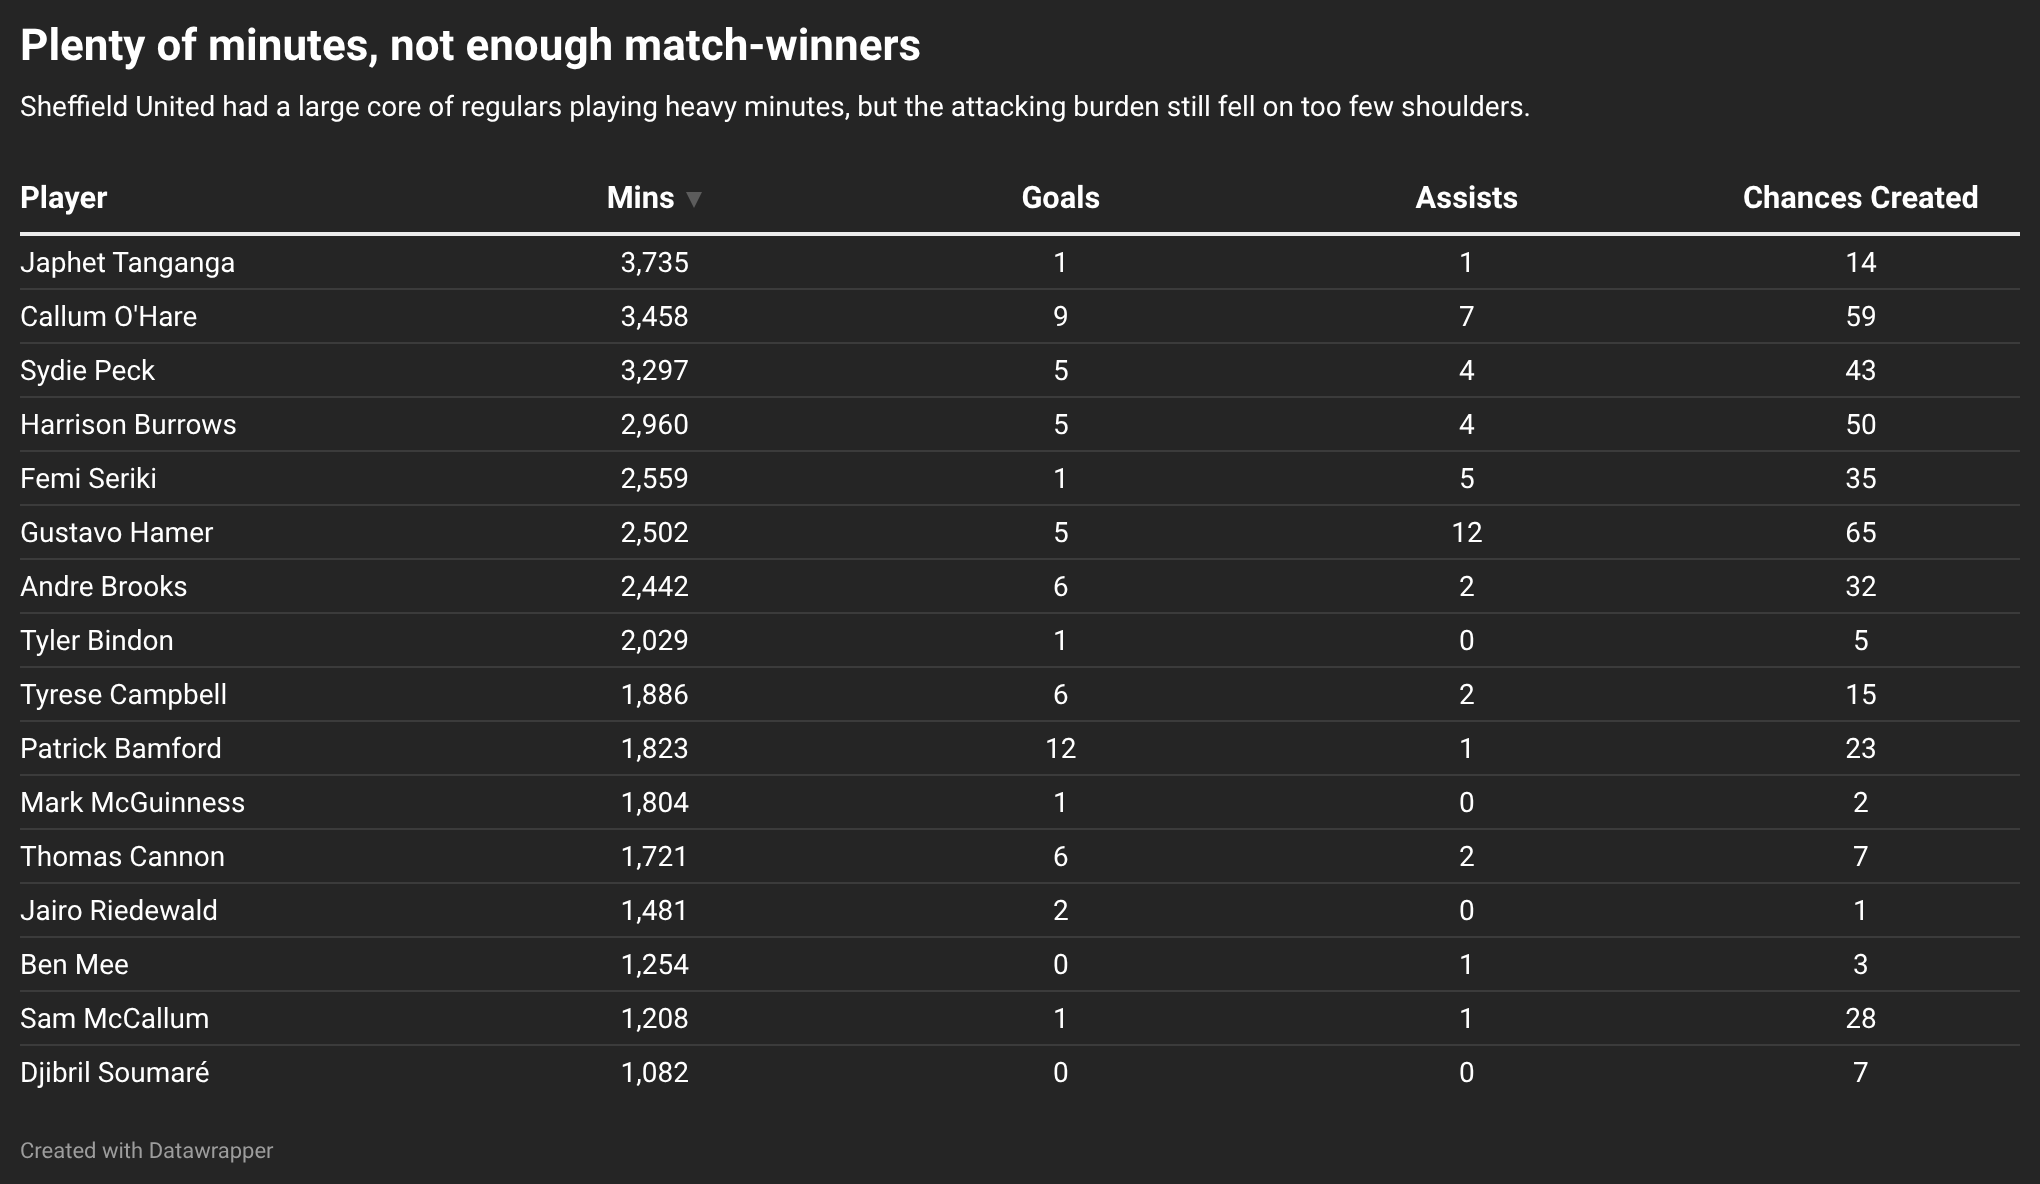
Pat on the head for Patrick Bamford: he was the only player in double figures for goals, while Hamer and O’Hare carried most of the creative load with 77 chances created and 19 assists between them.
Still, for a side that created plenty overall, the end product was spread ridiculously thinly.
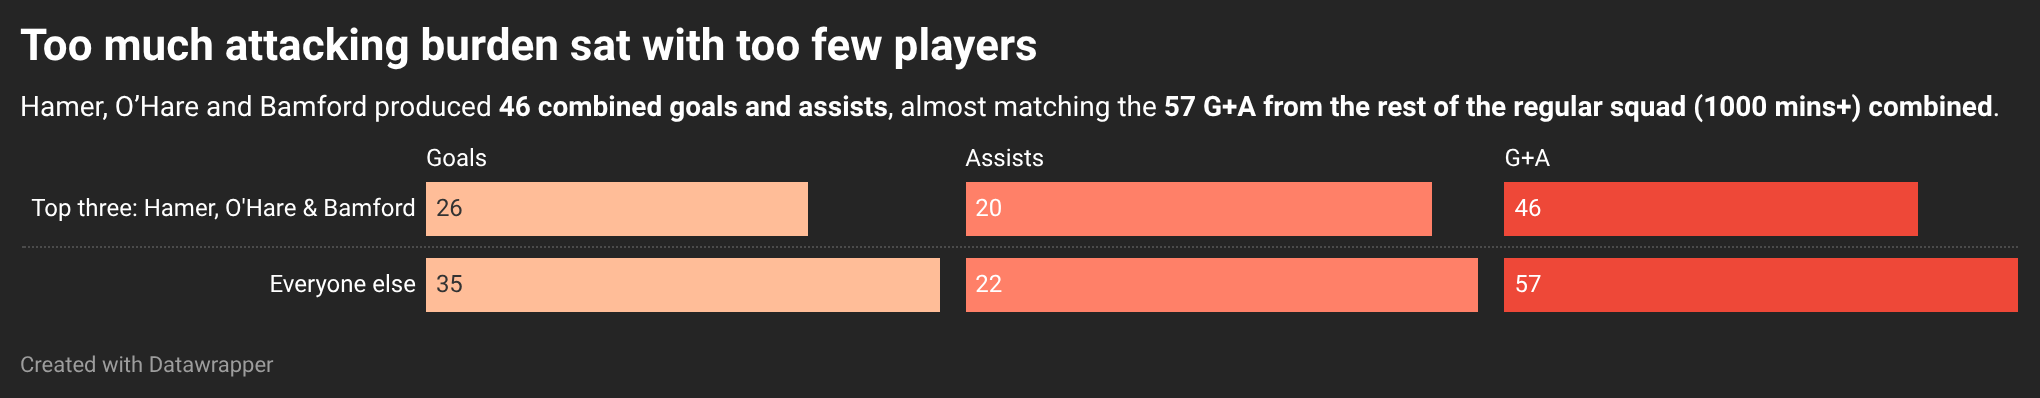
There are many data outputs other than goals and assists, I grant you. But this is what football trades in, and over 25/26, we lacked goal contributors. If, say, we had a player like Kieffer Moore or Oli McBurnie, I have no doubt we’d have at least one more player on 10+ goals because there were other players who consistently got us into good positions.
One output which reflects our good positions is carrying, moving with the ball. It is perhaps more important than sheer dribbling ability; that knack for taking the ball from A to B and doing something with it at the end is what separates poor teams and good teams. This graph plots our players against progressive carries (moving it forwards) and carries that end with a chance.
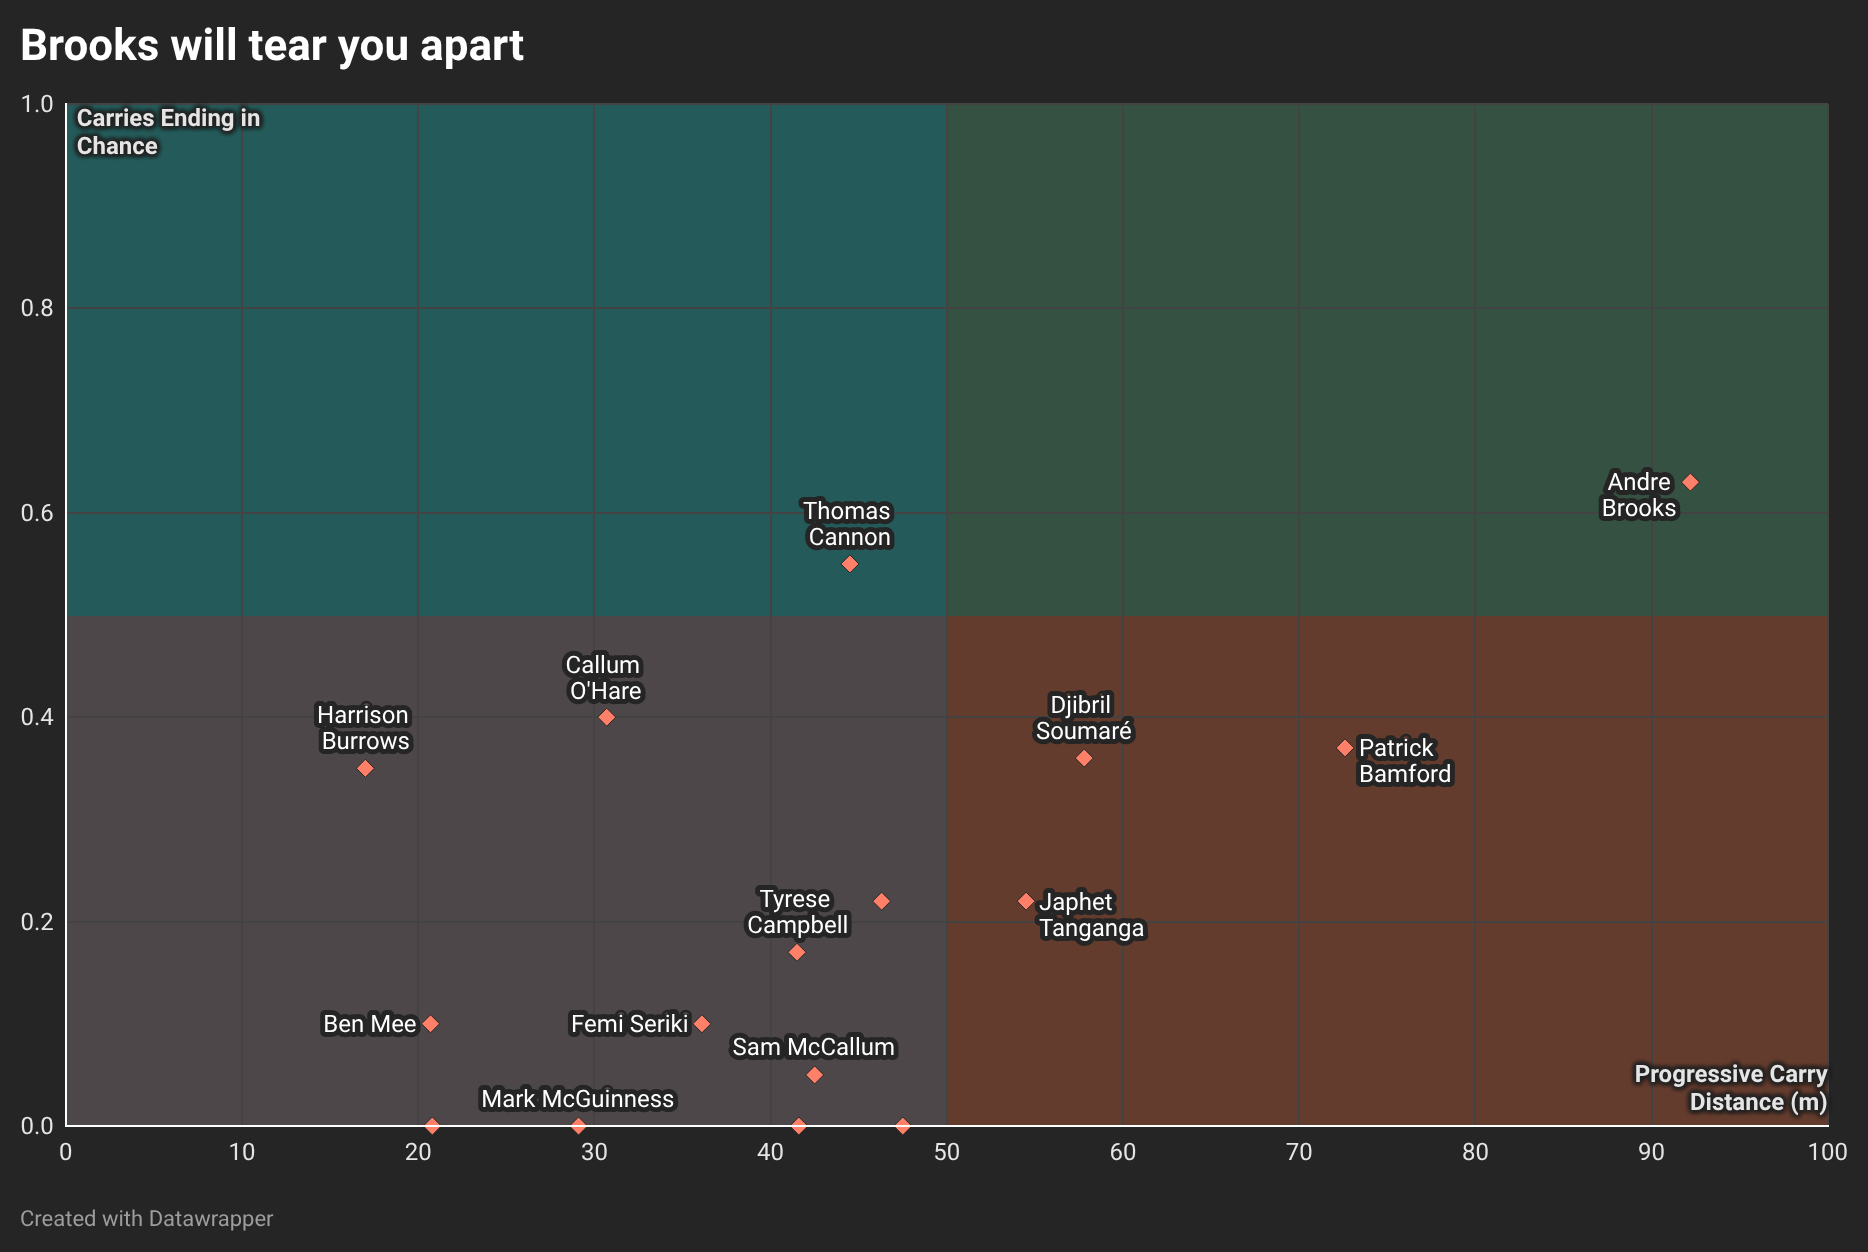
Andre Brooks combines Sheffield United’s highest progressive carry distance with the most carries ending in chances, underlining his importance as the side’s primary ball-carrying threat. It’s a unique skillset, a physical thing. And we’d miss that a lot if he were to leave.
Other players we’d miss if we lost their chance-creating abilities?
Here we see the plotting of overall chance creation with open play chance creation to give a picture that both includes and cuts out set-piece impact.
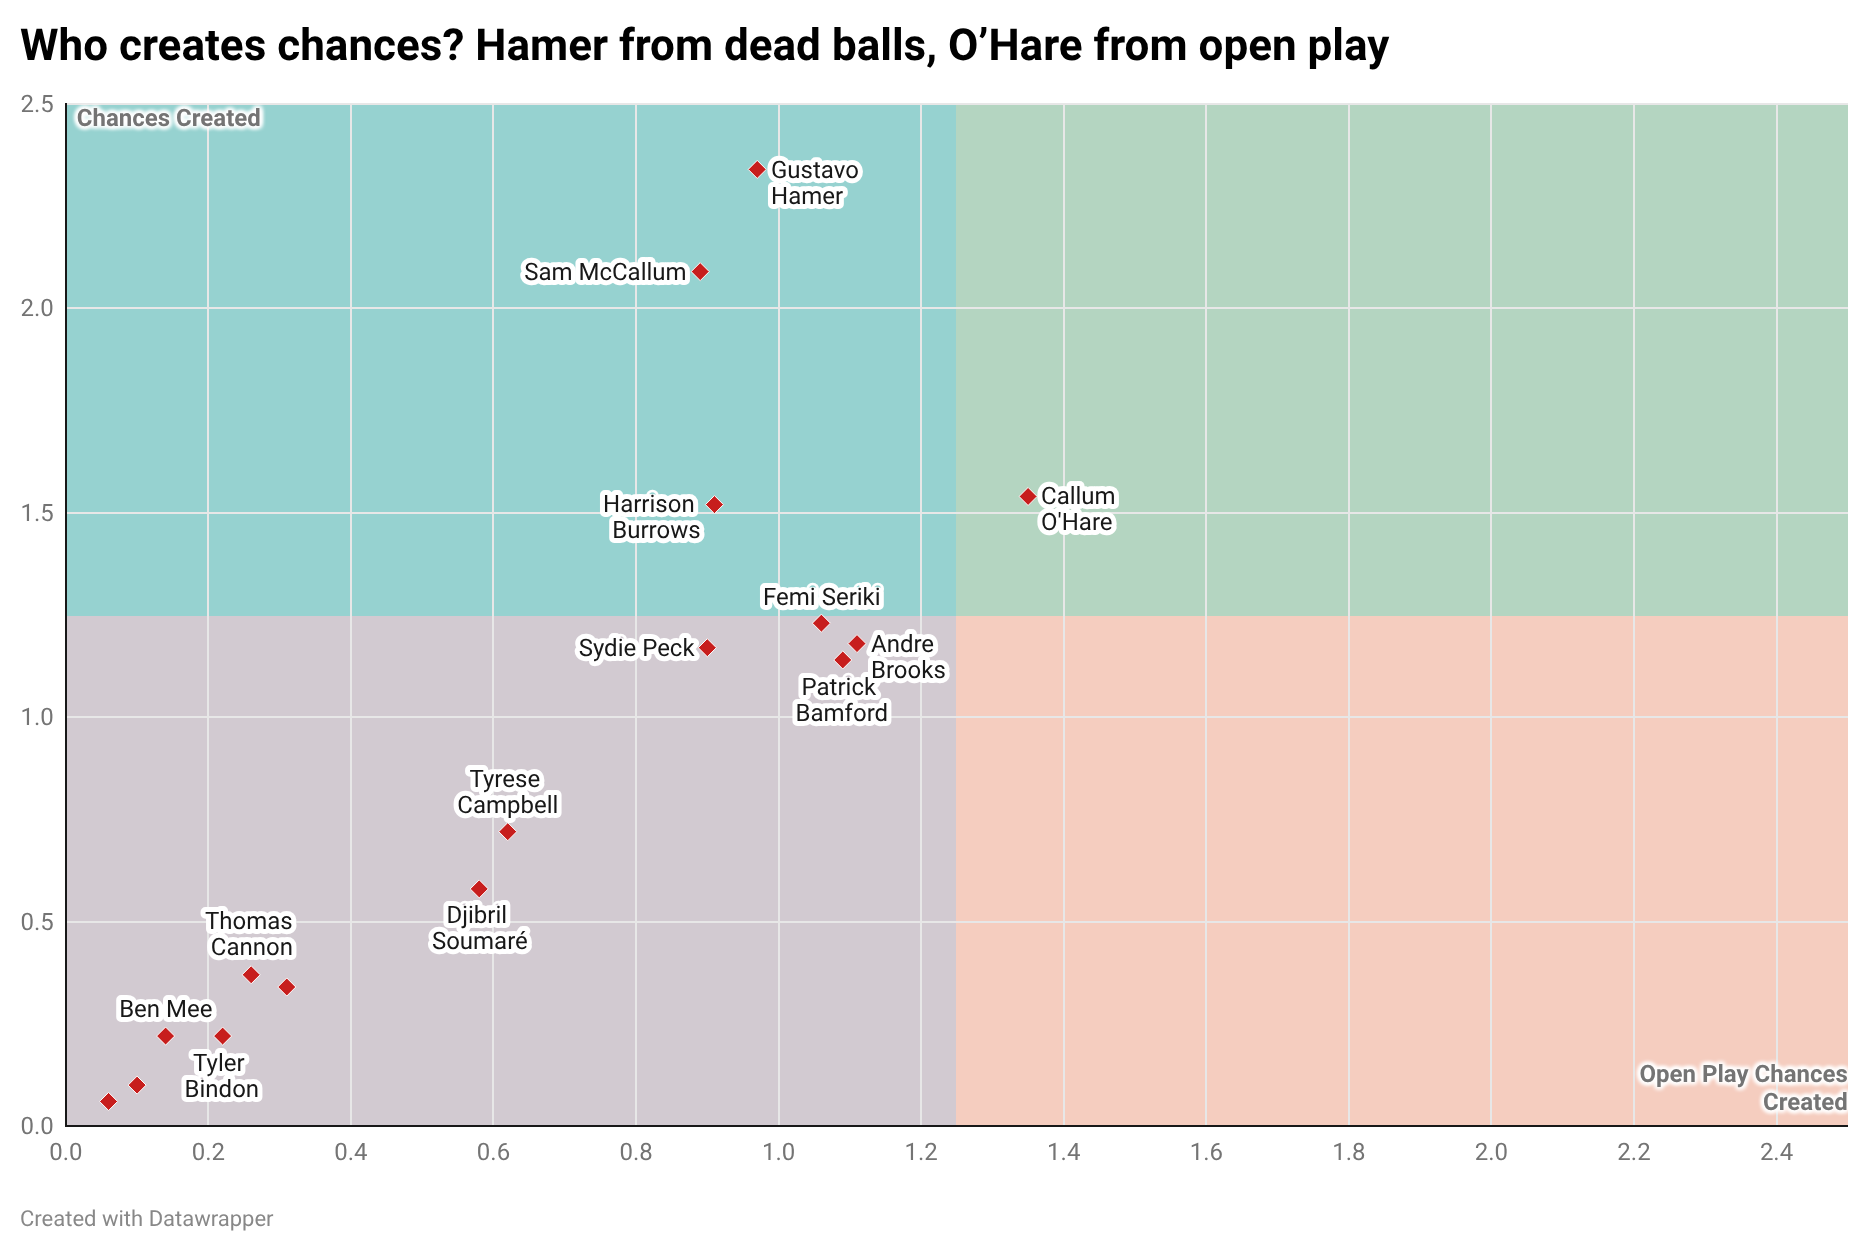
Gustavo Hamer leads Sheffield United for total chances created per 90, but some of that edge comes from set-piece delivery. In open play, Callum O’Hare is the side’s most productive creator per 90, with Brooks, Bamford, Seriki and Peck forming the next creative group.
And when we get the chances, to which player do we want them to fall…
It’s Patrick Bamford.
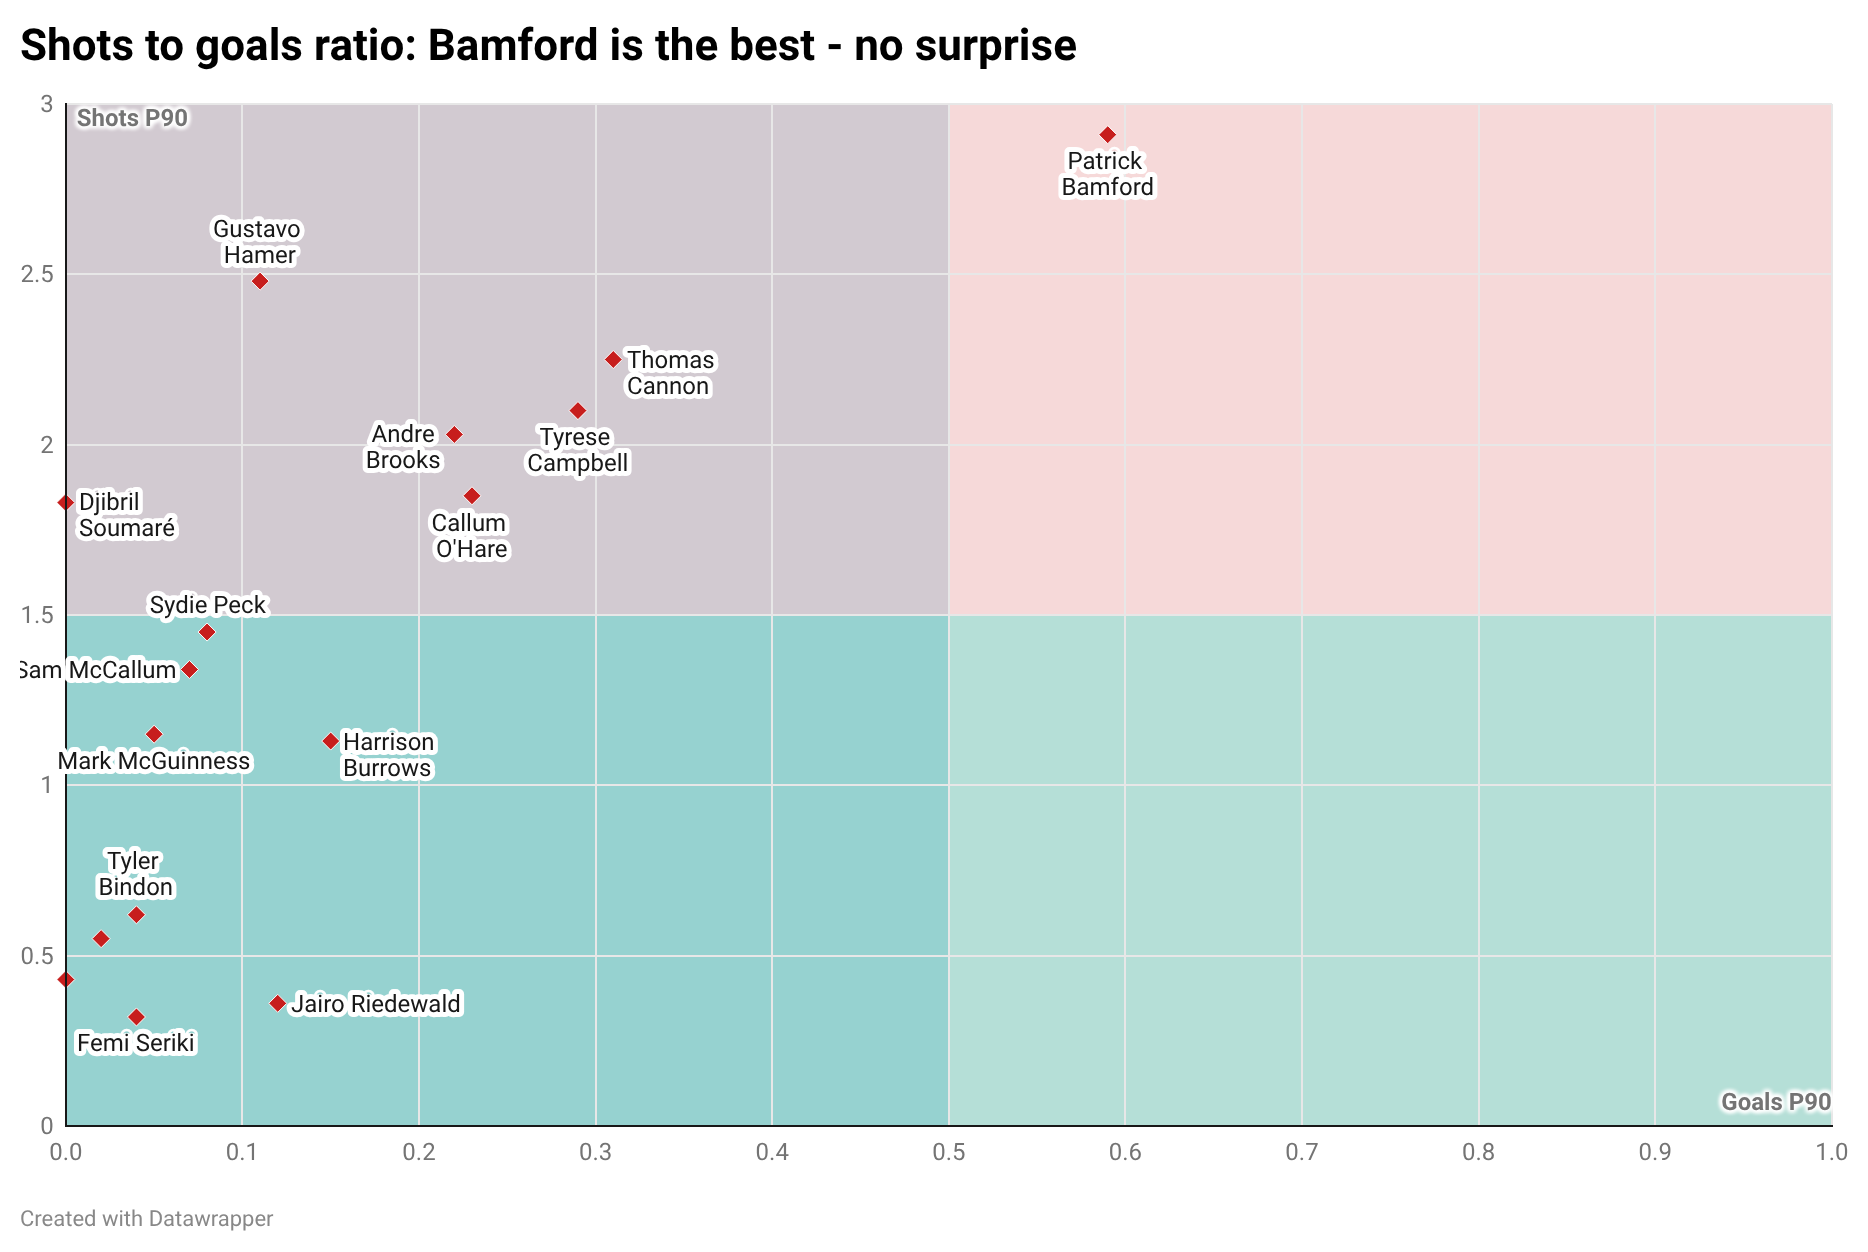
When comparing goals per game with shots per game, Bamford is comfortably our most dangerous scorer, combining the squad’s highest shot volume with the strongest goal output. Hamer, Cannon, Campbell and Brooks all shoot regularly but convert at a much lower rate, while several midfielders post middling shot numbers with crap end product.
Going the other way
A quick look at defensive output. I don’t always love defensive numbers, because a poor side is going to have to make more tackles/blocks etc. than a good one. But here’s a comparison between aerial duels won and ground duels won. It gives some indication about which of our players is better at what.
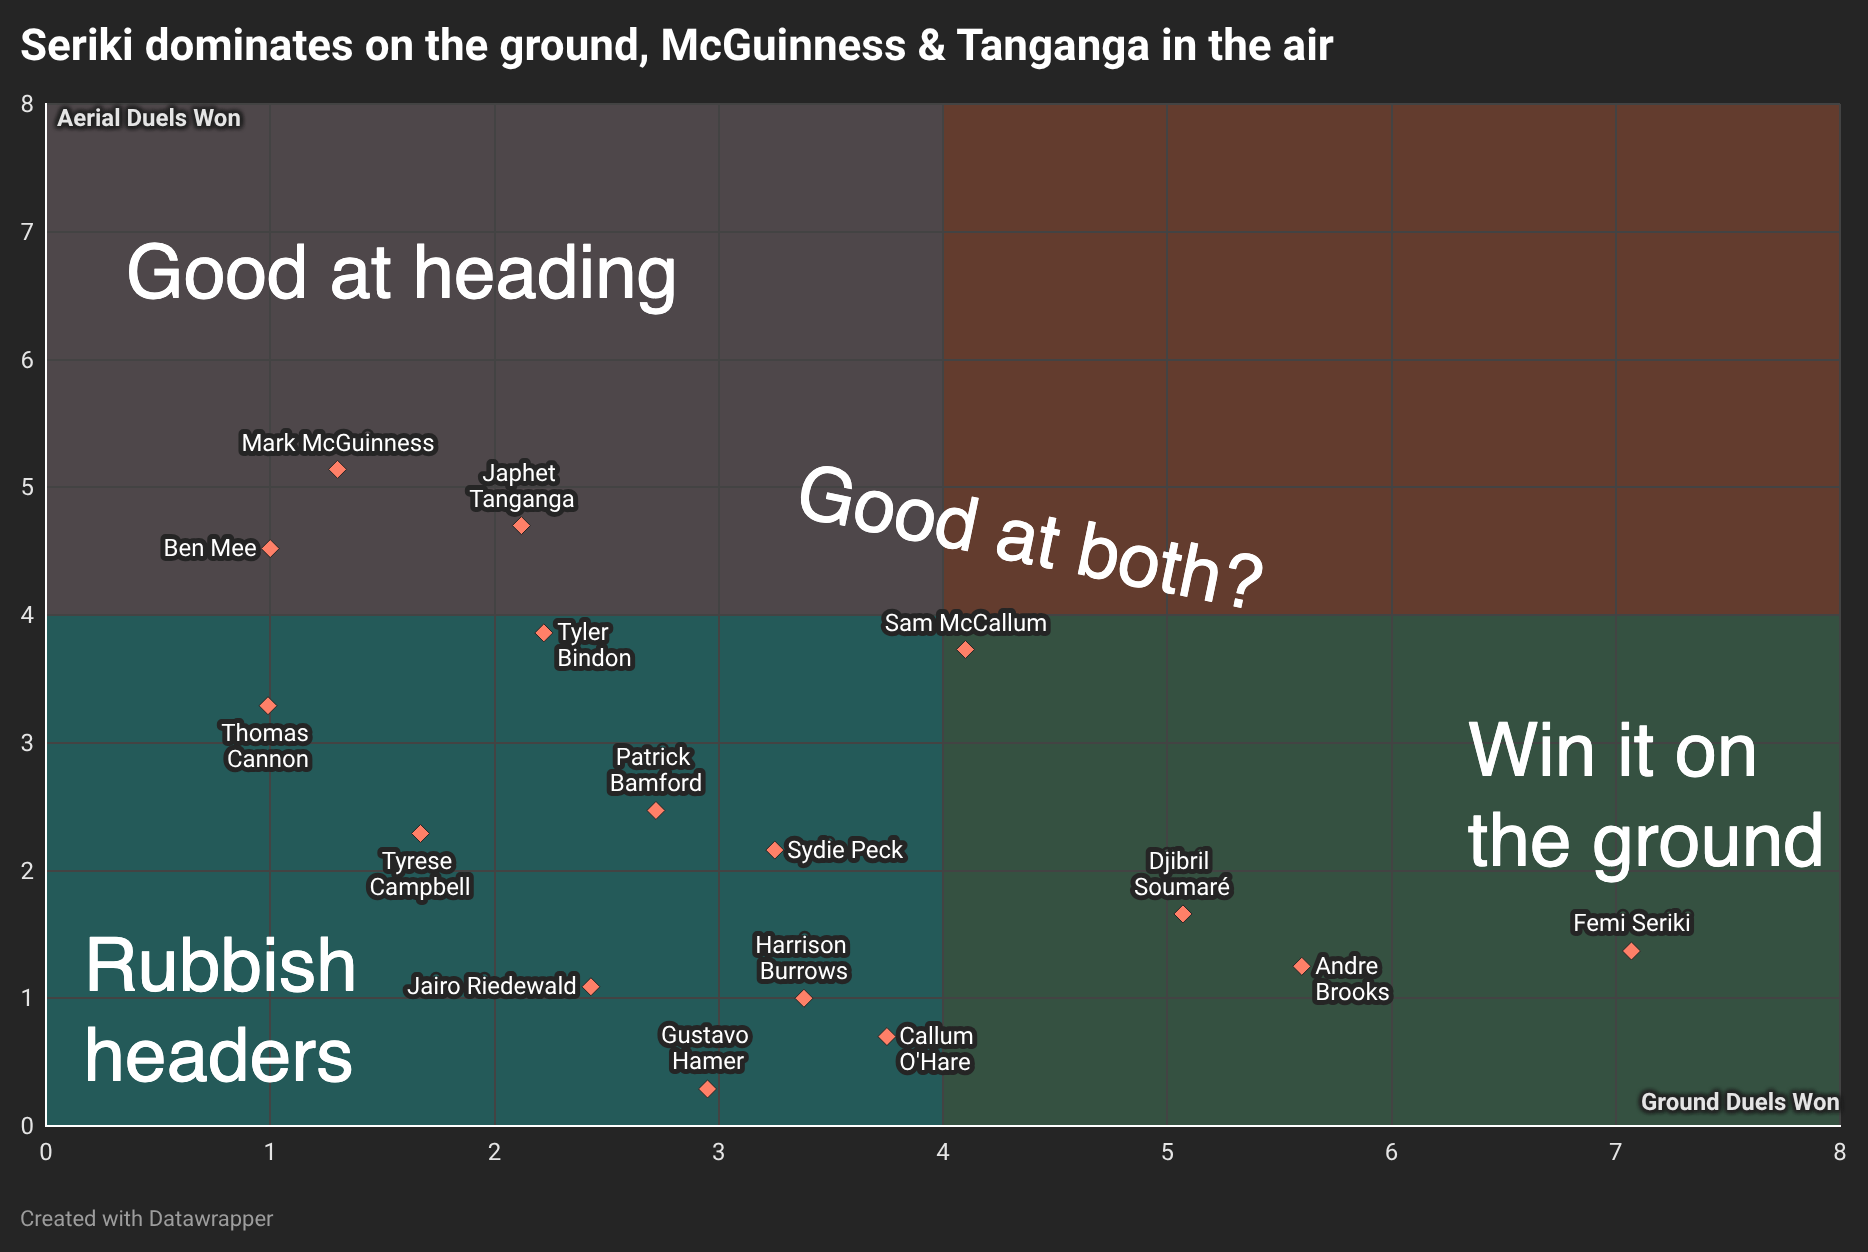
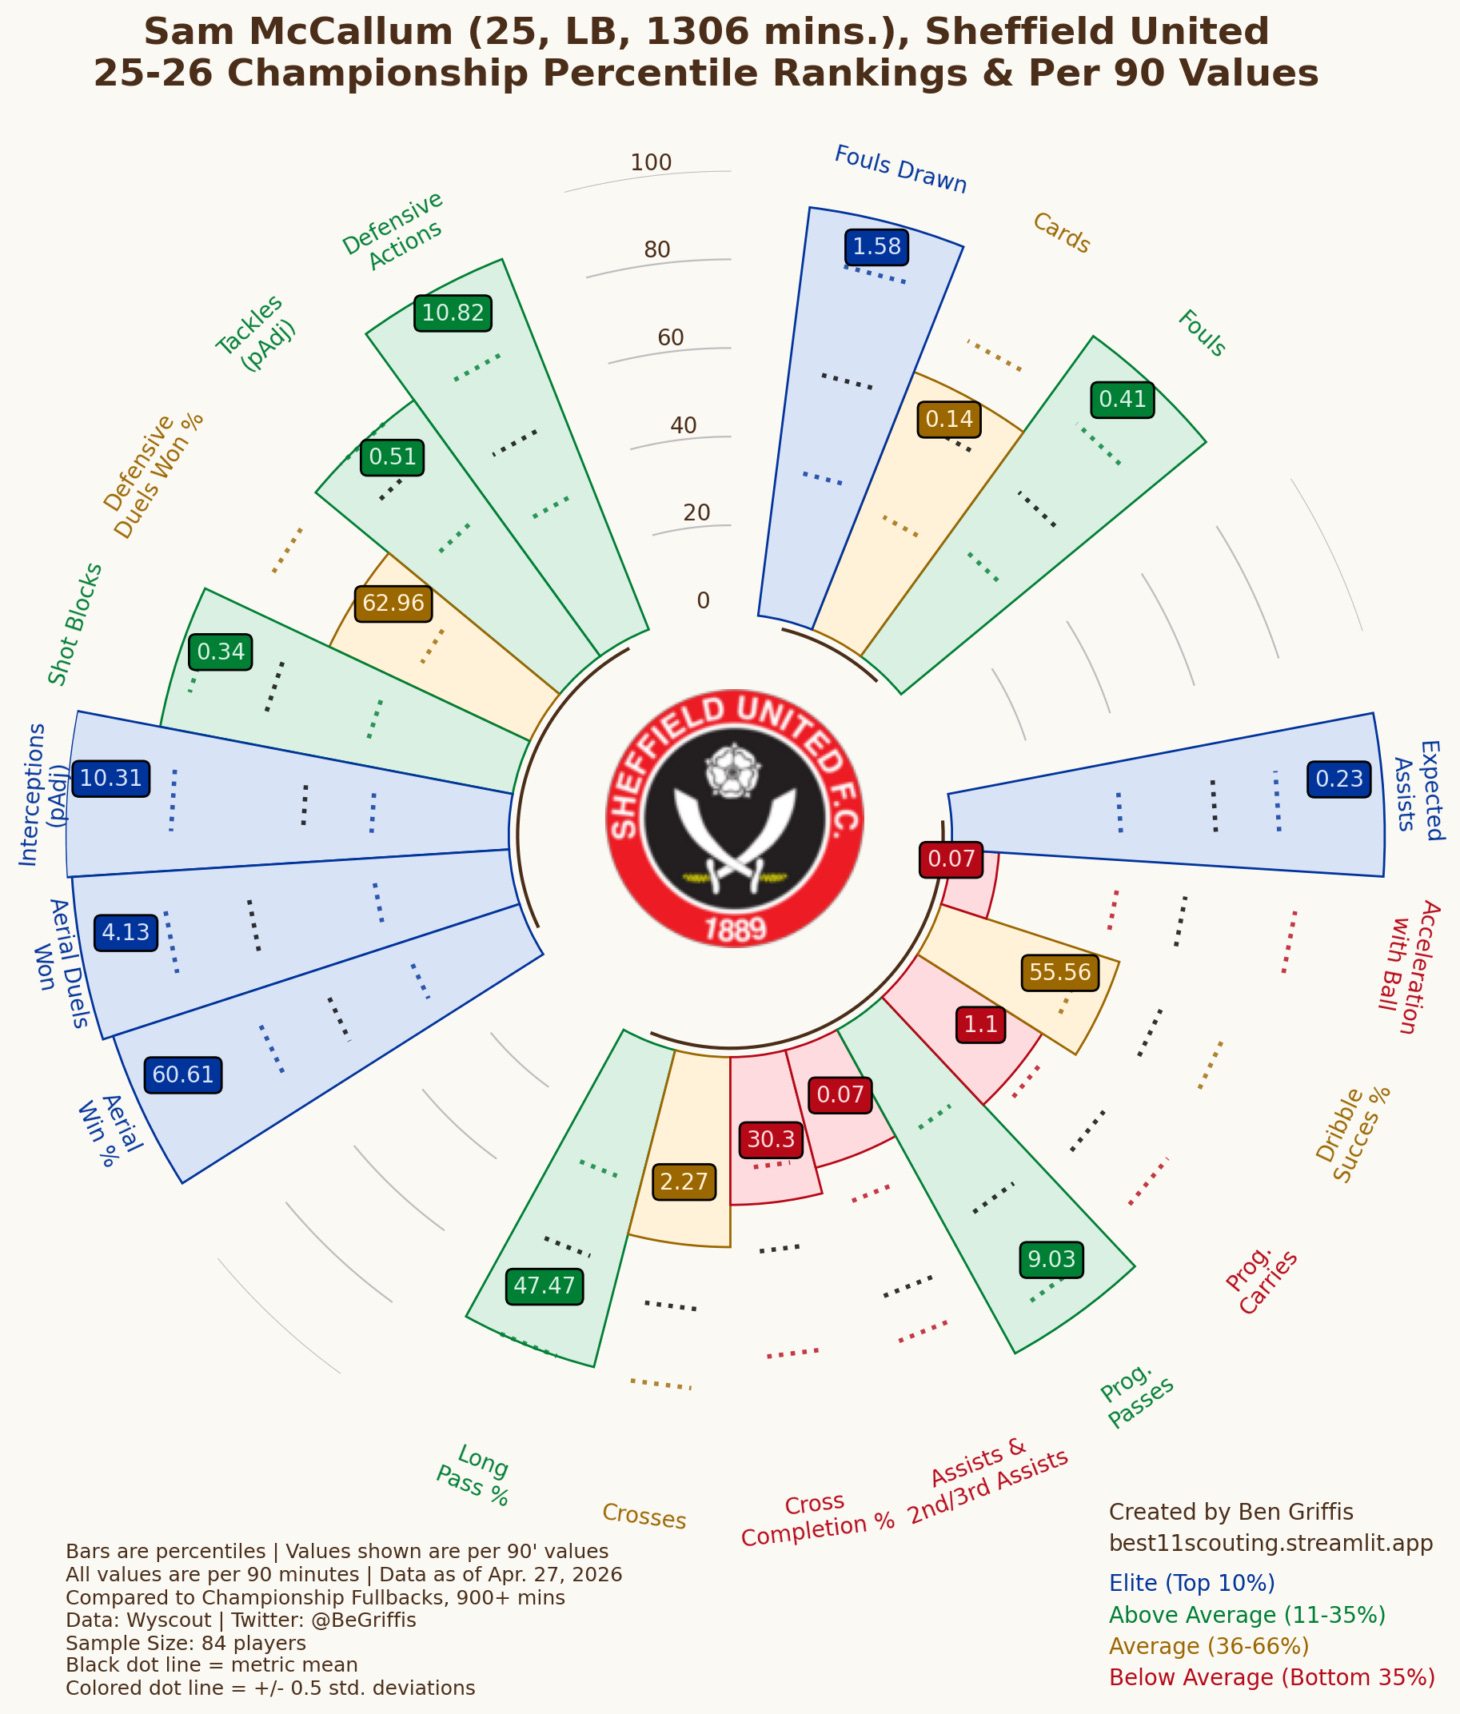
There are some standout numbers here. Femi Seriki and Andre Brooks’ defensive output is clearly of huge benefit down our right. So too for Sam McCallum in his minutes, though unfortunately, the same can’t be said of Burrows and Hamer.
As for the centre-backs: yeah, they win a lot of headers. It’s their job. Bamford wins a fair number too, and it’s amazing to think of what this season might’ve looked like without a target up top. Clearly, he’s been one of the bright stars of a dim campaign.
Who were the stars? Let’s try a top 5:
Now, this is not my personal top 5. Instead, I am making use of a brilliant app by Ben Griffis, which compares the top-performing Championship players by metrics relevant to their respective positions (filtered by 1,000+ minutes played). It’s a much better reflection of player quality than, say, Fotmob ratings or Fantasy Football etc.
Here we go…
5️⃣ The 6th-highest-ranked “Attacking Full Back” in the league
4️⃣ The 6th-highest-ranked “Defensive Midfielder” in the league
3️⃣ The 5th-highest-ranked “Advanced Striker” in the league

2️⃣ No.1 “Defensive Midfielder” in the league (2nd due to fewer mins)
1️⃣ The highest-ranked “playmaking winger” in the league

The Championship’s top-assist maker improved his Goals+Assists from 16 in 24/25 to 17 in 25/26, over fewer games and in a poorer side. Losing Hamer in the summer would be massive. He’s been a joy, even when he does those virtue-signalling, lost-cause presses. Always bringing a smile to the face, a goal from nothing, a pass nobody else saw.
Interestingly, other players up there according to the app were Harrison Burrows and Mark McGuinness. Perhaps it’s a surprise to see no Andre Brooks, Femi Seriki or Callum O’Hare amongst the top-rated players in their positions. For the record they were ranked:
Andre Brooks — #16 — Inside Forward
Femi Seriki — #13 — Attacking Right Back
Callum O’Hare — #15 — Advanced Playmaker
Had I filtered out players with fewer than 2,000 minutes, all those three would’ve ranked higher. But I didn’t. So there.
Conclusion
From the day after QPR (H) until 28 Feb 2026, no team in the Championship secured more points than Sheffield United (38). That was a 20-game period when we were the “best” side in the league, at least according to the points return. Thirty-eight: it’s a figure just shy of 60% of our points in 43% of our games.
Hell, I want to dwell on the good times and not the bad. Because, as I searched for reasons to dismiss this United team, the biggest flaw I found was not a lack of quality, but underperformance born of inconsistency. When this Blades side turned it on, our dominance was at times that of an automatic contender. Look at the xG share here:
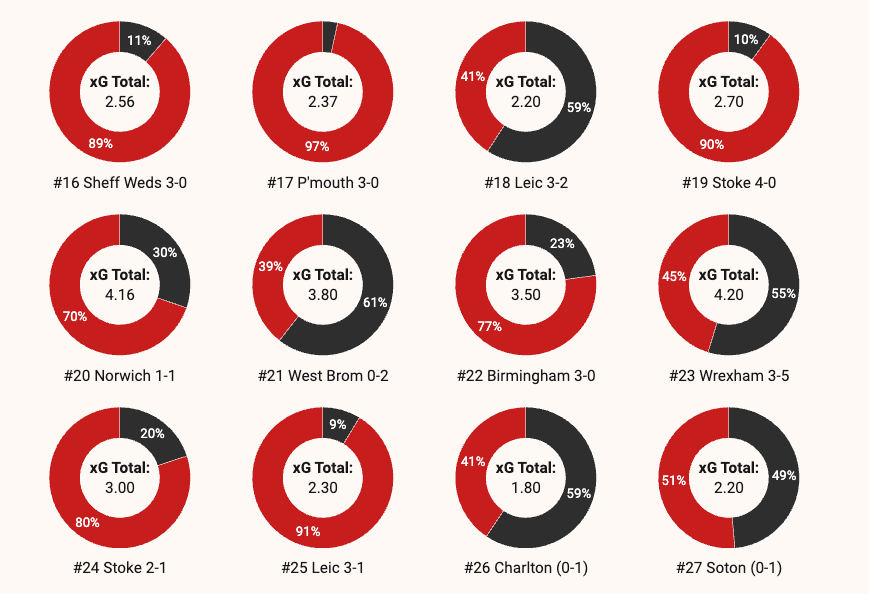
Those moments of utter domination were too fleeting, but they did exist. I suppose the question they leave behind is whether they were an unrepeatable hot streak. I’m not sure. If you take away the first 15 games (when we were dreadful) and the last 10 (when play-off motivation died), you could argue we were pretty damn good.
Too many “ifs” for my liking. So what about, as a final temperature check, we look at Chris Wilder’s spell only? That feels fair.
All 40 of Chris Wilder’s matches
They are sorted by bands of Expected Goal Difference (xG-xGA)
This gives a reflection of the number of games in which we created more chances than our opponents
I’ve divided these up into bands of Positive (slight and strong), Even, Negative (slight and strong).
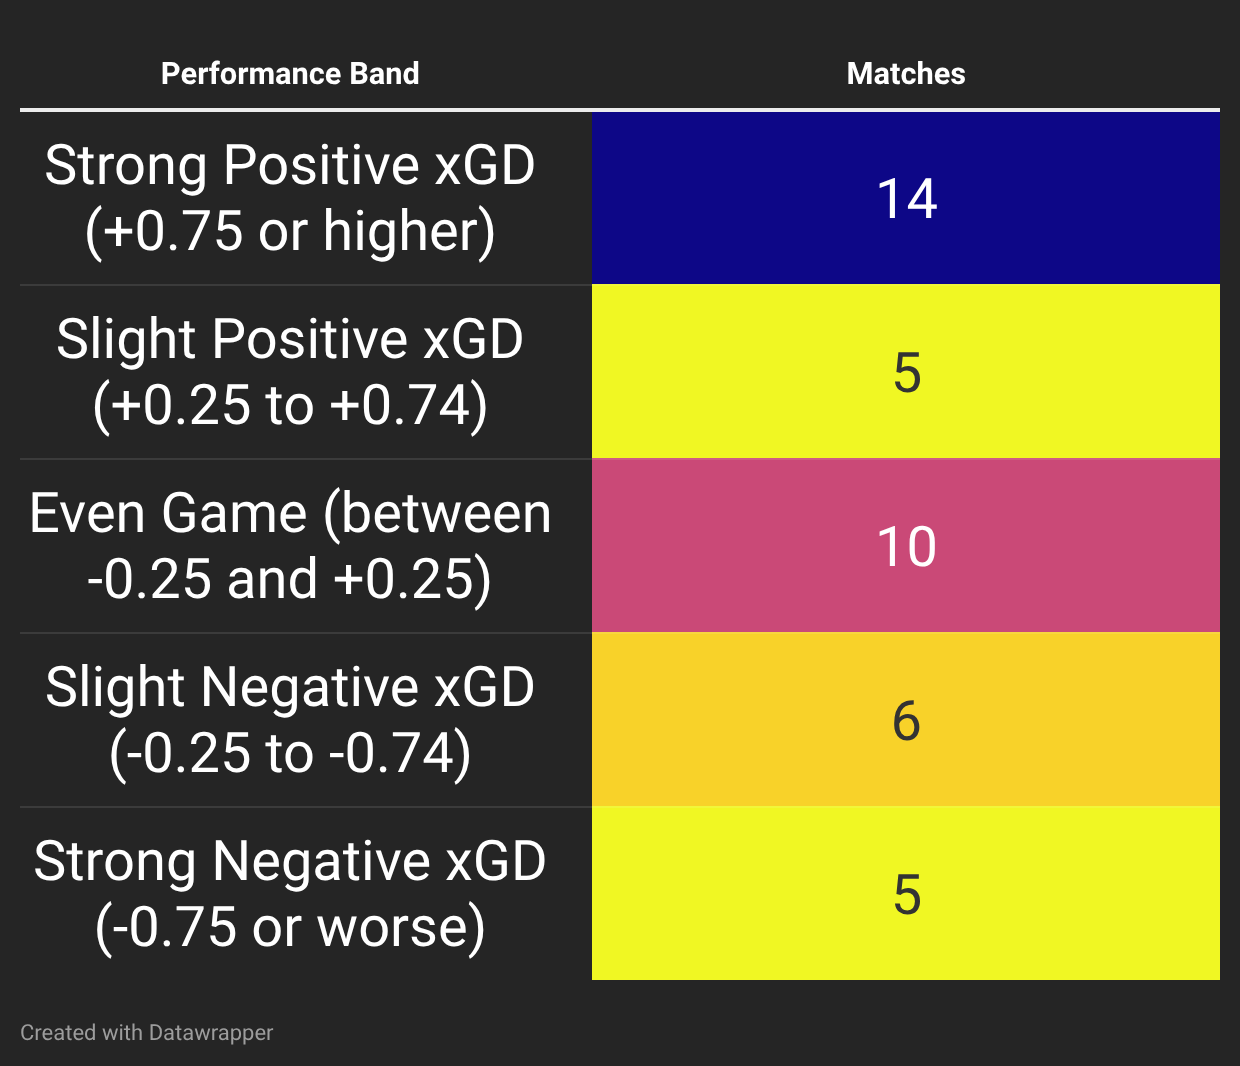
There were far more dominant performances than dreadful performances. There were 19 clear positive performances to 11 clear negatives. Which leads me to the conclusion that the league table does lie. We’re not the thirteenth-best team in this division; we’re much better than that.
If the Championship ran for 1,000 games, we’d be closer to the top than the bottom. But it doesn’t. And our final position reflects, on the one hand, a terrible summer window, and on the other, what happens to a team when there is no upwards or downwards pressure at the business end of the season.
With that, I’ll call time on this incredibly long piece. Looking ahead to next season, I am perhaps more positive than I should be. The level of positivity depends on the ins and outs, although six play-off places will only ever revise my expectations upward.
No matter what, I expect greater consistency to pay dividends in 26/27: same manager, smaller squad, and sensible if unspectacular signings. Imagine what might’ve been if we’d had just a bang-average summer, Michael Cooper had saved a few more shots, and Patrick Bamford had played a full season.
Outstanding piece of work. Worth a subscription on its own. So I’ve done one right now.
I’m unable to listen to Wilder’s vacuous cliches and mangled syntax any more. But… maybe there’s something in his pressers that’s more than just reflexive regurgitation of well-grooved excuses. Giving him the benefit of the doubt that he does see something of this bigger picture, does he also have the skill set to address the issues that you’ve so eloquently described? I’m not so sure. Modern football needs more than just “feel”, allied to a bit of badge-kissing.
What I’d be interested to see, post-rebuild, is a similar analysis that looks to discover whether some of the issues described here have been addressed by the recruitment.
Anyway, really terrific piece. Thanks so much.
Allen
Thank you, Sam.
It was incredibly long, but also incredibly researched and detailed; a marvellous piece to cover the “season of flux” and “on-field meh-ness”.
The bits that had me nodding the most were: “oppositions spotted our approach”, “blocking … is one of the poorest parts of our game”, and the fact that we lack “that knack for taking the ball fro A to B and doing something with it at the end”.
However, there were some very positive points, too, and, indeed, “there were far more dominant performances than dreadful performances”, so although we were left feeling a little sad by the last few games, let us all hope the incomings and outgoings work out for 2026/27.
Thanks again for a remarkably thoughtful and well detailed summary.
Sue.