

Don't Forget The Maths – Oliver McBurnie
Data Scientist Ed Morris: If Oli McBurnie returns to the starting line-up against Chelsea he offers much more than just goals in the red and white.

Ed Morris - @datawithed
More Than Goals in the Red and White
Having broken our own 2020/21 record of “worst-ever start to a Premier League campaign”, there have been very few reasons to be cheerful in 2023/24. Things have been looking up since Chris Wilder returned to the top job, but even the most optimistic fans recognise that the Blades are still looking down the barrel of a likely relegation.
However, one thing has been apparent: Sheffield United look like a better side with Oli McBurnie leading the line. Whilst the Scotsman’s goal-scoring rate in red and white certainly doesn’t turn any heads considering his £18m fee (22 goals in 132 appearances), his other qualities have been paramount to what little success we have had this season. At first glance, it makes sense – a big target man who seems to love fighting for a header. But how does that help us?
As a data scientist working in sport, I’m going to look to the data for the answers. We’ll compare the team’s performance with and without Oli Mac in some crucial areas, see how his presence affects his teammates’ actions, and establish how important his availability might be for our survival hopes.
Thinking Inside the Box…
They say the best form of defence is attack, so we’ll start there. McBurnie has only been directly involved in three goals this season, a penalty against Manchester United, a header against Bournemouth and his fantastic touch and lay-off to assist Cameron Archer against Everton. But what else is he bringing to the side?
Let’s start by looking at the locations of our shots with and without him in the side.
As you can see (below), despite playing far less than half of our Premier League minutes this season due to injury (a story for another time!) we can see our shot map looks much busier with him on the pitch. There are a few things we can take away from these two maps
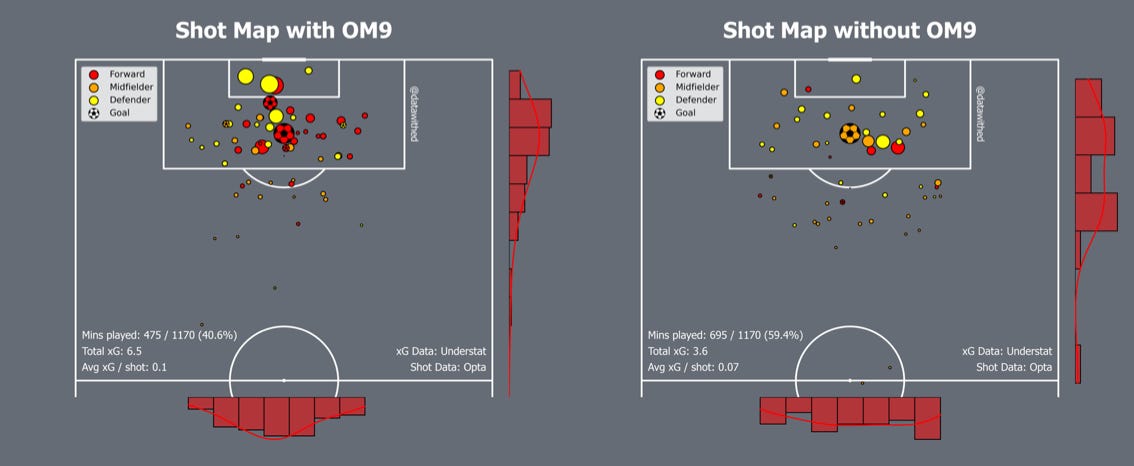
(1) Our forwards are having more shots
In the shot map without McBurnie, we can see very few shots taken from our forwards at all, and very few of those are efforts we would consider “good chances”. This certainly passes the eye test when it comes to McBurnie’s absence: our other forwards rarely have the ball at their feet anywhere near the opposition box, let alone in a position to get a shot away.
With McBurnie on the pitch, we see far more dots in red representing our forwards’ shots. This isn’t to say he’s the one taking the shots, but affording the other forwards, such as Archer, the time to get into the box to find space. A prime example of this was his brilliant finish following McBurnie’s lay-off against Everton.
(2) The average quality of our chances is higher
Here the larger the circle, the higher the xG for that shot. For the traditionalists among us, xG (Expected Goals) is a value between 0 and 1, giving us an idea of the likelihood of scoring from a certain position on the pitch, based on thousands of similar shots in the past.
For example, a shot with an xG value of 0.1 is one we would expect to be converted once in every 10 efforts from the same position. Whilst the xG stat in isolation is widely misused, it can paint a picture over a decent sample size like above.
The 40.6% of Premier League minutes we’ve played with McBurnie has produced an average xG value per shot of 0.1, versus 0.07 without. A 30% drop in the average quality of shot opportunities we’re creating is very significant, which statistically leads to far fewer goals scored in the long term.
(3) We’re shooting closer to goal
The histograms on the right-hand side of each plot show that we have a high concentration of shots taken between 6 and 18 yards from goal with McBurnie in the side, compared to a much wider spread of shots, including a large spike of shots well outside the box without him.
This large proportion of shots outside the box shows us taking far more speculative efforts at goal without McBurnie, showcasing our poor chance creation in the final third. This also demonstrates that we are having more success entering the opponent’s penalty area to create shooting opportunities with the Scot on the pitch. His presence as the focal point of our front line helps us retain possession higher up the pitch rather than relying on the likes of our smaller forwards like Archer, Brewster and Traore to hold the ball up against huge Premier League defenders. This in turn gives the likes of Hamer and McAtee the freedom to venture out of our own half with more success, giving them more license to create.
Potent Possession
Speaking of Hamer and McAtee, they are the undisputed creativity in a team that isn’t attacking all that much. As a result, it is crucial that when we do attack they are afforded the opportunities to create something special. As mentioned above, I believe McBurnie’s possession retention over the halfway line is key to unlocking creative opportunities for Hamer and McAtee, but how can we be sure? Below are some pass heatmaps for the midfield duo, showing the highest concentrations of start and end locations of their passing range with and without McBurnie in the side:
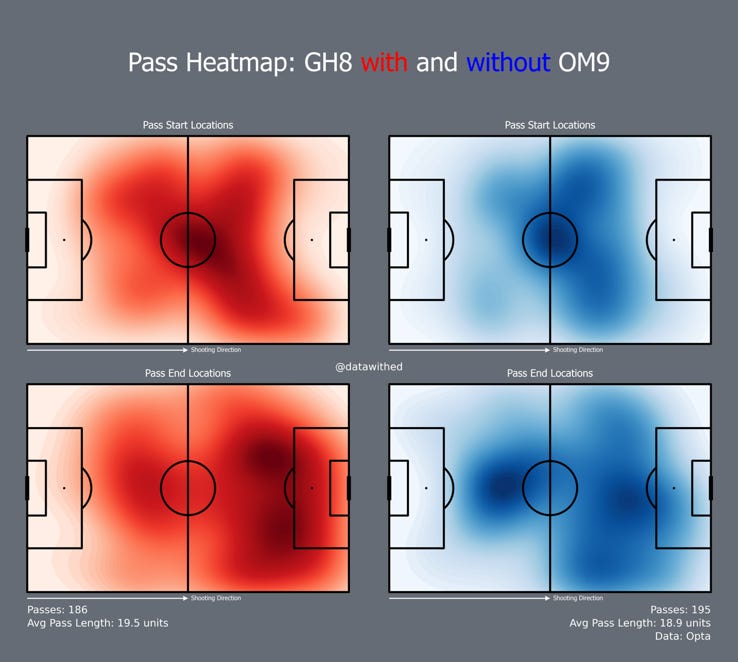
The difference here is stark; whilst taking up largely similar passing positions in something of an “X” shape across the halfway line both with and without McBurnie, the pass end locations heatmap is worth a thousand words. Two heavily concentrated areas right on the edge of the opposition's 18-yard box in red, showing progressive passing intent into dangerous areas.
In blue, the largest concentration sits inside our own half where Hamer is recycling the ball, emphasising his efforts to retain possession rather than looking forward himself, which produces a rather negative product.
In addition to this, without McBurnie on the pitch, Hamer often finds himself one of the highest (if not the highest) players on the pitch when attacking, where he seems to be much less effective than when sat deeper in the midfield. The other concentrations in blue show more of a bias out to the wings in the final third, where we might expect to find a certain James McAtee
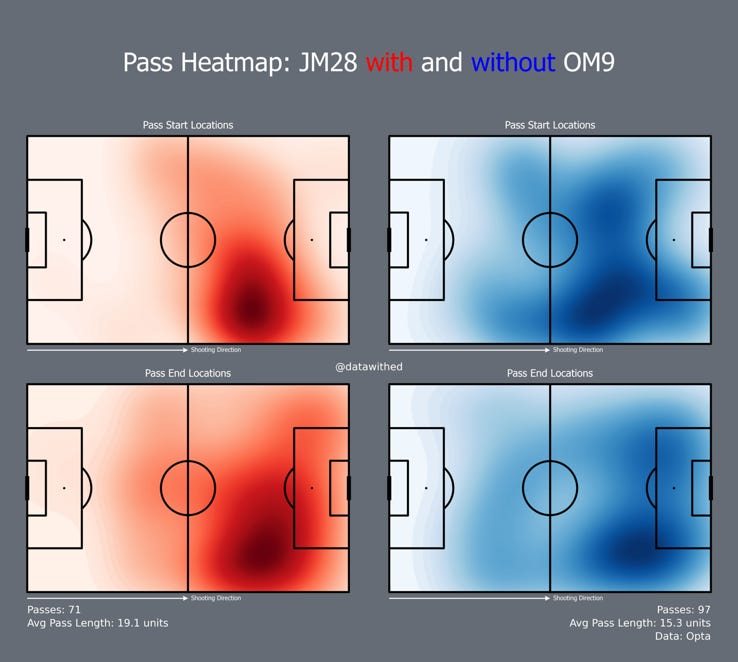
In blue, we see McAtee on the right as we often expect but also spread across central areas, attempting to influence play more broadly across the front line when we are lacking a focal point in our attack. His passes are typically into dangerous zones with a large focus on his favoured right-hand side, but his average pass length is much shorter which indicates safer, more retention-focussed passing.
In red, it’s a different picture; a definitive role on the right flank where he's most effective, with a very concentrated region from which he is attempting passes and sending them to. Having McBurnie to play off allows McAtee to concentrate on creating rather than retaining possession, playing passes in and around the final third on the right-hand side, inside to the edge of the 18-yard box, and occasionally sending the play across the field to the left flank.
We can also see a large increase in his average pass length too. With a target man to play off, McAtee can look forwards with a focus on creativity and riskier play, either via passing up the field or his excellent ball-carrying skills, where he’s often at his most dangerous.
The Widemen
As a team that has predominantly played some variation of a 3-5-2 in possession — and even now with Wilder’s four at the back formation — width is crucial. Let’s look back at the wing-back option and see what it can tell us.
Luke Thomas and Jayden Bogle have played the majority of minutes in these positions this season, with Thomas (until recently) securing his place in the side at LWB over Larouci, and Bogle being our only fit RWB for much of the season to date. Required to put in the hard yards up and down their respective flanks, the two must provide value in both attack and defence. Therefore, for this section of the analysis, I will be analysing their positions on the pitch by looking at all events that they’re involved in. Once again, their areas of influence differ significantly with and without our #9’s presence in the side.
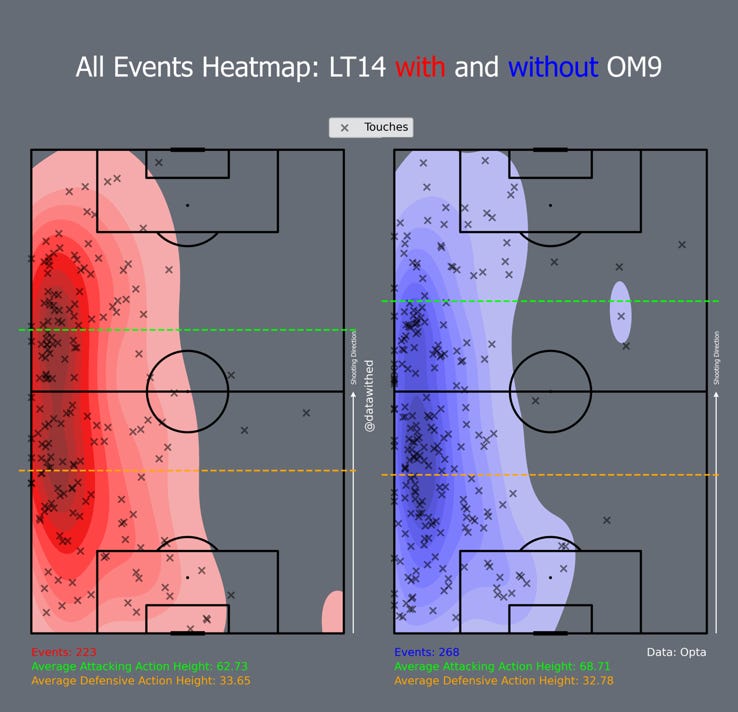
Starting with Thomas, we see in blue that his highest concentration of contributions are centred in our half, with some influence in the opposition half. He also drifts into our own box in both visuals (where he often trades places with Robinson when tracking runners) and manages to get up to the edge of the opposition box too.
In red, we can see that he exerts much more influence on the game in the opposition half. His average contribution takes place somewhere just over the halfway line and has more involvement towards the centre of the pitch as seen by the wider spread across the centre circle. Again, this is likely due to our improved ball retention higher up the pitch thanks to McBurnie, allowing Thomas to get up the pitch and aid attacks more frequently, linking up with our strikers/advanced midfielders in these more central areas.
What is interesting to note is his narrower window of attacking vs defensive contributions when McBurnie is in the side — his attacking contributions sit on average 6.5m further back than without him, despite his average involvement on the pitch sitting higher up (e.g. touches, non-progressive passes etc). This may be linked to his preference to pass the ball up the pitch, as seen in his 31 progressive passes this season, bested only by Norwood and Hamer in midfield, rather than getting down the wing himself.
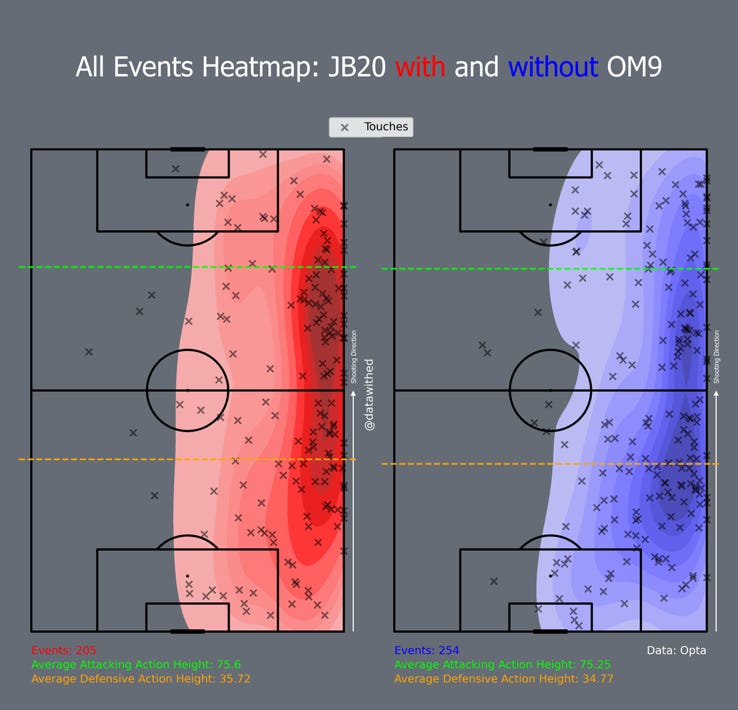
Contrary to this, Bogle certainly has an eye for getting forward regardless of McBurnie’s involvement. However, his heatmap of contributions is almost flipped upside-down depending on his presence in the side, sitting much higher up in the opposition half with him and much deeper in our half without. His average attacking and defensive contribution height don’t differ materially between the two scenarios, but his general involvement in the game does (e.g. touches, non-progressive passes etc).
In both Thomas’ and Bogle’s cases, this is again likely due to McBurnie’s excellent ball retention allowing the entire team to move up the pitch without ceding possession and getting involvement outside our own defensive third.
The Remaining 22
Following Wilder's return of the manager who brought McBurnie to Bramall Lane, what can we expect to see from our #9 for the rest of this season?
Big questions still linger over his ability to stay fit for prolonged periods, but assuming he is available he's unlikely to be kept out of the starting XI by Osula for long. The youngster has done a stellar job of leading the line given his age, but McBurnie's experience at this level combined with his physicality to combat Premier League defenders is likely to push him back into the starting XI sooner rather than later.
I can't see our formation changing much from the 4-3-3 we've seen under Wilder so far in possession — expect to see the Scot playing in the middle of a front-three with Archer on the left and McAtee on the right. With Hamer brought back into his natural role deeper in the midfield alongside Brooks and his brave drives forward with the ball, I think any concerns about the Blades reverting to "hoof-ball" are greatly exaggerated.
Great. So, what now?
Unfortunately, in football, there are no definitive right or wrong answers in analysis. Every visual in this article could be interpreted differently to my depictions, and nobody would know if they were more right or wrong than me. And some of you may place a big question mark next to McBurnie’s fitness and temperament (two red cards this season). But I think, love him or hate him, our best performances this season (pre-Wilder) have come with McBurnie in the side. With the Scot out of contract next summer and available to sign pre-contracts with other teams in January, our recruitment team will have a big job replacing him if he isn’t tied down to a new deal soon. And even though he’s not set the world alight with his goals for the Blades to date, he opens doors for those around him to operate at their best, offering more than just goals in the red and white…
I excellent, I knew he was brilliant, now I have the data to prove it! Although you missed the graphic showing red cards with and without OM on the pitch!
It will be interesting to see how Wilder utilises McB if selected. Will we go long and high more often? I hope not, I think he is better holding the ball up with ball to feet.
Thank you, Ed
What great analysis. Those heat maps are really telling – it’s difficult to grasp exactly where players are the most to be found in any given game, but to see it set down in black & white (well, red & blue) like that is intriguing.
I have to admit that I’ve never really warmed to McBurnie – he’s too volatile and unpredictable for me, but I can see what you’re getting at here: “…even though he’s not set the world alight with his goals for the Blades to date, he opens doors for those around him to operate at their best …” Now that we do have the ‘smaller’ players in attack, if he can maintain his aptitude and flair for a goal or a pass, stay fit and not lose his temper so often, he really could become a hot property.
Sue.